.data_labels
class: DataLabel
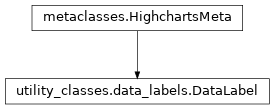
- class DataLabel(**kwargs)[source]
Options for the series data labels, appearing next to each data point.
Class Inheritance
- copy(other=None, overwrite=True, **kwargs)
Copy the configuration settings from this instance to the
otherinstance.- Parameters:
other (
HighchartsMeta) – The target instance to which the properties of this instance should be copied. IfNone, will create a new instance and populate it with properties copied fromself. Defaults toNone.overwrite (
bool) – ifTrue, properties inotherthat are already set will be overwritten by their counterparts inself. Defaults toTrue.kwargs – Additional keyword arguments. Some special descendents of
HighchartsMetamay have special implementations of this method which rely on additional keyword arguments.
- Returns:
A mutated version of
otherwith new property values
- classmethod from_dict(as_dict: dict, allow_snake_case: bool = True)
Construct an instance of the class from a
dictobject.
- classmethod from_js_literal(as_str_or_file, allow_snake_case: bool = True, _break_loop_on_failure: bool = False)
Return a Python object representation of a Highcharts JavaScript object literal.
- Parameters:
as_str_or_file (
str) – The JavaScript object literal, represented either as astror as a filename which contains the JS object literal.allow_snake_case (
bool) – IfTrue, interpretssnake_casekeys as equivalent tocamelCasekeys. Defaults toTrue._break_loop_on_failure (
bool) – IfTrue, will break any looping operations in the event of a failure. Otherwise, will attempt to repair the failure. Defaults toFalse.
- Returns:
A Python object representation of the Highcharts JavaScript object literal.
- Return type:
HighchartsMeta
- classmethod from_json(as_json_or_file, allow_snake_case: bool = True)
Construct an instance of the class from a JSON string.
- Parameters:
as_json_or_file – The JSON string for the object or the filename of a file that contains the JSON string.
allow_snake_case (
bool) – IfTrue, interpretssnake_casekeys as equivalent tocamelCasekeys. Defaults toTrue.
- Returns:
A Python objcet representation of
as_json.- Return type:
HighchartsMeta
- get_required_modules(include_extension=False) List[str]
Return the list of URLs from which the Highcharts JavaScript modules needed to render the chart can be retrieved.
- to_dict() dict
Generate a
dictrepresentation of the object compatible with the Highcharts JavaScript library.Note
The
dictrepresentation has a property structure and naming convention that is intentionally consistent with the Highcharts JavaScript library. This is not Pythonic, but it makes managing the interplay between the two languages much, much simpler.
- to_js_literal(filename=None, encoding='utf-8', careful_validation=False) str | None
Return the object represented as a
strcontaining the JavaScript object literal.- Parameters:
along the way using the esprima-python library. Defaults to
False.Warning
Setting this value to
Truewill significantly degrade serialization performance, though it may prove useful for debugging purposes.
- to_json(filename=None, encoding='utf-8')
Generate a JSON string/byte string representation of the object compatible with the Highcharts JavaScript library.
Note
This method will either return a standard
stror abytesobject depending on the JSON serialization library you are using. For example, if your environment has orjson, the result will be abytesrepresentation of the string.- Parameters:
- Returns:
A JSON representation of the object compatible with the Highcharts library.
- Return type:
- static trim_dict(untrimmed: dict, to_json: bool = False, context: str = None) dict
Remove keys from
untrimmedwhose values areNoneand convert values that have.to_dict()methods.- Parameters:
untrimmed (
dict) – Thedictwhose values may still beNoneor Python objects.to_json (
bool) – IfTrue, will remove all keys fromuntrimmedthat are not serializable to JSON. Defaults toFalse.context (
strorNone) – If provided, will inform the method of the context in which it is being run which may inform special handling cases (e.g. where empty strings may be important / allowable). Defaults toNone.
- Returns:
Trimmed
dict- Return type:
- static trim_iterable(untrimmed, to_json=False, context: str = None)
Convert any
EnforcedNullTypevalues inuntrimmedto'null'.- Parameters:
untrimmed (iterable) – The iterable whose members may still be
Noneor Python objects.to_json (
bool) – IfTrue, will remove all members fromuntrimmedthat are not serializable to JSON. Defaults toFalse.context (
strorNone) – If provided, will inform the method of the context in which it is being run which may inform special handling cases (e.g. where empty strings may be important / allowable). Defaults toNone.
- Return type:
iterable
- property align: str | None
The alignment of the data label compared to the point. Defaults to
None.Accepts:
'left''center''right'
Hint
If right, the right side of the label should be touching the point.
- Returns:
The alignment of the annotation’s label.
- Return type:
- property allow_overlap: bool | None
If
True, data labels are allowed to overlap each other.Defaults to
False.Hint
To make the labels less sensitive for overlapping, the
DataLabel.padding()can be set to0.
- property animation: AnimationOptions | None
Enable or disable the initial animation for the data labels when a series is displayed.
The animation can also be set as a configuration object. Please note that this option only applies to the initial animation of the series itself. For other animations, see
Chart.animationand theanimationparameter under the (JavaScript) API methods. The following properties are supported:defer: The animation delay time in milliseconds.
Warning
Due to poor performance, animation is disabled in old IE browsers for several chart types.
- Return type:
AnimationOptionsorNone
- property background_color: str | Gradient | Pattern | None
The background color or gradient for the data label. Defaults to
None.
- property border_radius: int | float | Decimal | None
The border radius (in pixels) applied to the data label. Defaults to
0.- Returns:
The border radius to apply to the data label.
- Return type:
numeric or
None
- property border_width: int | float | Decimal | None
The border width (in pixels) applied to the data label. Defaults to
0.- Returns:
The border width to apply to the data label.
- Return type:
numeric or
None
- property class_name: str | None
A classname to apply styling using CSS. Defaults to
'highcharts-no-tooltip'.
- property color: str | None
The text color for the data labels. Defaults to
None.Note
For certain series types, like column or map, the data labels can be drawn inside the points. In this case the data label will be drawn with maximum contrast by default. Additionally, it will be given a
text-outlinestyle with the opposite color, to further increase the contrast. This can be overridden by setting thetext-outlinestyle tononein theDataLabel.style()setting.
- property crop: bool | None
If
True, hide part of the data label that falls outside the plot area. Defaults toFalse.Note
By default, the data label is moved inside the plot area as per the
DataLabel.overflow()setting.
- property defer: bool | int | None
Whether to defer displaying the data labels until the initial series animation has finished. If
None, behaves as if set toTrue.Setting to
Falserenders the data label immediately.If set to
Trueinherits the defer time set inPlotOptions.series.animation().If set to a number, defers the animation by that number of milliseconds.
- property enabled: bool | None
Enable or disable the data labels. Setting to
Nonebehaves as if set toFalse.
- property filter: Filter | None
A declarative filter to control of which data labels to display.
The declarative filter is designed for use when JavaScript callback functions are not available, like when the chart options require a pure JSON structure or for use with graphical editors. For programmatic control, use the
DataLabel.formatter()instead, and returnundefinedto disable a single data label.
- property formatter: CallbackFunction | None
JavaScript callback function to format the data label. Defaults to
None.Note
If a
DataLabel.format()is specified, the formatter will be ignored.- Returns:
A JavaScript callback function.
- Return type:
CallbackFunctionorNone
- property inside: bool | None
For points with an extent, like columns or map areas, whether to align the data label inside the box or to the actual value point. Defaults to
:obj:`None <python:None>`, which behaves like ``Falsein most cases butTruein stacked columns.
- property null_format: str | None
Format for points with the value of
null. Defaults toNone.Note
Works analogously to
DataLabel.format().Warning
Can only be applied only to series which support displaying null points.
- property null_formatter: CallbackFunction | None
JavaScript callback function to format the text of the data label for visible null points.
Note
Works analogously to
DataLabel.formatter().Warning
Can only be applied only to series which support displaying null points.
- Return type:
CallbackFunctionorNone
- property overflow: str | None
Configuration on how to handle a data label that overflows outside of the plot area. Defaults to
'justify', which aligns them inside the plot area. For columns and bars, this means the data label will be moved inside the bar.Hint
To display data labels outside the plot area, set
overflowto'allow'andDataLabel.crop()toFalse.Accepts:
'justify'- which forces the label back into the plot area'allow'- which allows data labels to overflow outside of the plot area
Note
The overflow treatment is also affected by the
DataLabel.crop()setting.
- property padding: int | None
The padding within the border box when either
DataLabel.border_width()orDataLabel.background_color()is set.Defaults to
5.
- property position: str | None
Aligns data labels relative to points. Defaults to
'center'.Accepts the following values:
'center'(the default)'left''right'
Note
If
centeris not possible, aligns toright.- Return type:
- property rotation: int | float | Decimal | None
Text rotation in degrees. Defaults to
0Warning
Due to a more complex structure, backgrounds, borders and padding will be lost on a rotated data label.
- Return type:
numeric or
None
- property shadow: bool | ShadowOptions | None
Configuration for the shadow to apply to the data label box. Defaults to
False.If
False, no shadow is applied.
- property shape: str | None
The name of the symbol to use for the border around the label. Defaults to
'square'.Accepts:
'rect''square''circle''diamond''triangle''callout'
- property style: dict | str | None
CSS styling to apply to the annotation’s label.
The default color setting is
"contrast", which is a pseudo color that Highcharts picks up and applies the maximum contrast to the underlying point item, for example the bar in a bar chart.textOutlineis a pseudo property that applies an outline of the given width with the given color, which by default is the maximum contrast to the text. So a bright text color will result in a black text outline for maximum readability on a mixed background. In some cases, especially with grayscale text, the text outline doesn’t work well, in which cases it can be disabled by setting it to"none". WhenDataLabel.use_html()isTrue, thetextOutlinewill not be picked up. In this, case, the same effect can be acheived through thetext-shadowCSS property.For some series types, where each point has an extent, like for example tree maps, the data label may overflow the point. There are two strategies for handling overflow. By default, the text will wrap to multiple lines. The other strategy is to set
textOverflowto ellipsis, which will keep the text on one line plus it will break inside long words.
- property text_path: TextPath | None
Options for a label text which should follow marker’s shape.
Note
Border and background are disabled for a label that follows a path.
- property use_html: bool | None
If
True, will use HTML to render the data label. IfFalse, will use SVG or WebGL as applicable.Defaults to
False.
- property vertical_align: str | None
The vertical alignment of the annotation’s label. Defaults to
None.If
None, the alignment will depend on the data. For example, in a column chart, the label would be above positive values and below negative values.Accepts:
'bottom''middle''top'
- property x: int | float | Decimal | None
The x position offset of the label relative to the point. Defaults to
0.- Return type:
numeric or
None
class: OrganizationDataLabel
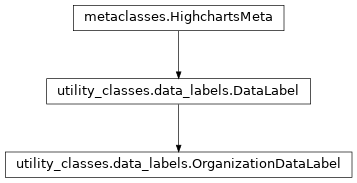
- class OrganizationDataLabel(**kwargs)[source]
Variant of
DataLabelused for organization series.Class Inheritance
- copy(other=None, overwrite=True, **kwargs)
Copy the configuration settings from this instance to the
otherinstance.- Parameters:
other (
HighchartsMeta) – The target instance to which the properties of this instance should be copied. IfNone, will create a new instance and populate it with properties copied fromself. Defaults toNone.overwrite (
bool) – ifTrue, properties inotherthat are already set will be overwritten by their counterparts inself. Defaults toTrue.kwargs – Additional keyword arguments. Some special descendents of
HighchartsMetamay have special implementations of this method which rely on additional keyword arguments.
- Returns:
A mutated version of
otherwith new property values
- classmethod from_dict(as_dict: dict, allow_snake_case: bool = True)
Construct an instance of the class from a
dictobject.
- classmethod from_js_literal(as_str_or_file, allow_snake_case: bool = True, _break_loop_on_failure: bool = False)
Return a Python object representation of a Highcharts JavaScript object literal.
- Parameters:
as_str_or_file (
str) – The JavaScript object literal, represented either as astror as a filename which contains the JS object literal.allow_snake_case (
bool) – IfTrue, interpretssnake_casekeys as equivalent tocamelCasekeys. Defaults toTrue._break_loop_on_failure (
bool) – IfTrue, will break any looping operations in the event of a failure. Otherwise, will attempt to repair the failure. Defaults toFalse.
- Returns:
A Python object representation of the Highcharts JavaScript object literal.
- Return type:
HighchartsMeta
- classmethod from_json(as_json_or_file, allow_snake_case: bool = True)
Construct an instance of the class from a JSON string.
- Parameters:
as_json_or_file – The JSON string for the object or the filename of a file that contains the JSON string.
allow_snake_case (
bool) – IfTrue, interpretssnake_casekeys as equivalent tocamelCasekeys. Defaults toTrue.
- Returns:
A Python objcet representation of
as_json.- Return type:
HighchartsMeta
- get_required_modules(include_extension=False) List[str]
Return the list of URLs from which the Highcharts JavaScript modules needed to render the chart can be retrieved.
- to_dict() dict
Generate a
dictrepresentation of the object compatible with the Highcharts JavaScript library.Note
The
dictrepresentation has a property structure and naming convention that is intentionally consistent with the Highcharts JavaScript library. This is not Pythonic, but it makes managing the interplay between the two languages much, much simpler.
- to_js_literal(filename=None, encoding='utf-8', careful_validation=False) str | None
Return the object represented as a
strcontaining the JavaScript object literal.- Parameters:
along the way using the esprima-python library. Defaults to
False.Warning
Setting this value to
Truewill significantly degrade serialization performance, though it may prove useful for debugging purposes.
- to_json(filename=None, encoding='utf-8')
Generate a JSON string/byte string representation of the object compatible with the Highcharts JavaScript library.
Note
This method will either return a standard
stror abytesobject depending on the JSON serialization library you are using. For example, if your environment has orjson, the result will be abytesrepresentation of the string.- Parameters:
- Returns:
A JSON representation of the object compatible with the Highcharts library.
- Return type:
- static trim_dict(untrimmed: dict, to_json: bool = False, context: str = None) dict
Remove keys from
untrimmedwhose values areNoneand convert values that have.to_dict()methods.- Parameters:
untrimmed (
dict) – Thedictwhose values may still beNoneor Python objects.to_json (
bool) – IfTrue, will remove all keys fromuntrimmedthat are not serializable to JSON. Defaults toFalse.context (
strorNone) – If provided, will inform the method of the context in which it is being run which may inform special handling cases (e.g. where empty strings may be important / allowable). Defaults toNone.
- Returns:
Trimmed
dict- Return type:
- static trim_iterable(untrimmed, to_json=False, context: str = None)
Convert any
EnforcedNullTypevalues inuntrimmedto'null'.- Parameters:
untrimmed (iterable) – The iterable whose members may still be
Noneor Python objects.to_json (
bool) – IfTrue, will remove all members fromuntrimmedthat are not serializable to JSON. Defaults toFalse.context (
strorNone) – If provided, will inform the method of the context in which it is being run which may inform special handling cases (e.g. where empty strings may be important / allowable). Defaults toNone.
- Return type:
iterable
- property align: str | None
The alignment of the data label compared to the point. Defaults to
None.Accepts:
'left''center''right'
Hint
If right, the right side of the label should be touching the point.
- Returns:
The alignment of the annotation’s label.
- Return type:
- property allow_overlap: bool | None
If
True, data labels are allowed to overlap each other.Defaults to
False.Hint
To make the labels less sensitive for overlapping, the
DataLabel.padding()can be set to0.
- property animation: AnimationOptions | None
Enable or disable the initial animation for the data labels when a series is displayed.
The animation can also be set as a configuration object. Please note that this option only applies to the initial animation of the series itself. For other animations, see
Chart.animationand theanimationparameter under the (JavaScript) API methods. The following properties are supported:defer: The animation delay time in milliseconds.
Warning
Due to poor performance, animation is disabled in old IE browsers for several chart types.
- Return type:
AnimationOptionsorNone
- property background_color: str | Gradient | Pattern | None
The background color or gradient for the data label. Defaults to
None.
- property border_radius: int | float | Decimal | None
The border radius (in pixels) applied to the data label. Defaults to
0.- Returns:
The border radius to apply to the data label.
- Return type:
numeric or
None
- property border_width: int | float | Decimal | None
The border width (in pixels) applied to the data label. Defaults to
0.- Returns:
The border width to apply to the data label.
- Return type:
numeric or
None
- property class_name: str | None
A classname to apply styling using CSS. Defaults to
'highcharts-no-tooltip'.
- property color: str | None
The text color for the data labels. Defaults to
None.Note
For certain series types, like column or map, the data labels can be drawn inside the points. In this case the data label will be drawn with maximum contrast by default. Additionally, it will be given a
text-outlinestyle with the opposite color, to further increase the contrast. This can be overridden by setting thetext-outlinestyle tononein theDataLabel.style()setting.
- property crop: bool | None
If
True, hide part of the data label that falls outside the plot area. Defaults toFalse.Note
By default, the data label is moved inside the plot area as per the
DataLabel.overflow()setting.
- property defer: bool | int | None
Whether to defer displaying the data labels until the initial series animation has finished. If
None, behaves as if set toTrue.Setting to
Falserenders the data label immediately.If set to
Trueinherits the defer time set inPlotOptions.series.animation().If set to a number, defers the animation by that number of milliseconds.
- property enabled: bool | None
Enable or disable the data labels. Setting to
Nonebehaves as if set toFalse.
- property filter: Filter | None
A declarative filter to control of which data labels to display.
The declarative filter is designed for use when JavaScript callback functions are not available, like when the chart options require a pure JSON structure or for use with graphical editors. For programmatic control, use the
DataLabel.formatter()instead, and returnundefinedto disable a single data label.
- property formatter: CallbackFunction | None
JavaScript callback function to format the data label. Defaults to
None.Note
If a
DataLabel.format()is specified, the formatter will be ignored.- Returns:
A JavaScript callback function.
- Return type:
CallbackFunctionorNone
- property inside: bool | None
For points with an extent, like columns or map areas, whether to align the data label inside the box or to the actual value point. Defaults to
:obj:`None <python:None>`, which behaves like ``Falsein most cases butTruein stacked columns.
- property link_format: str | None
The format string specifying what to show for links in the organization chart.
- property link_formatter: CallbackFunction | None
JavaScript callback function to format data labels for links in the organization chart.
Note
The
.link_formatproperty takes precedence over thelink_formatter.- Return type:
- property link_text_path: TextPath | None
Options for a label text which should follow the link’s shape.
Note
Border and background are disabled for a label that follows a path.
- property null_format: str | None
Format for points with the value of
null. Defaults toNone.Note
Works analogously to
DataLabel.format().Warning
Can only be applied only to series which support displaying null points.
- property null_formatter: CallbackFunction | None
JavaScript callback function to format the text of the data label for visible null points.
Note
Works analogously to
DataLabel.formatter().Warning
Can only be applied only to series which support displaying null points.
- Return type:
CallbackFunctionorNone
- property overflow: str | None
Configuration on how to handle a data label that overflows outside of the plot area. Defaults to
'justify', which aligns them inside the plot area. For columns and bars, this means the data label will be moved inside the bar.Hint
To display data labels outside the plot area, set
overflowto'allow'andDataLabel.crop()toFalse.Accepts:
'justify'- which forces the label back into the plot area'allow'- which allows data labels to overflow outside of the plot area
Note
The overflow treatment is also affected by the
DataLabel.crop()setting.
- property padding: int | None
The padding within the border box when either
DataLabel.border_width()orDataLabel.background_color()is set.Defaults to
5.
- property position: str | None
Aligns data labels relative to points. Defaults to
'center'.Accepts the following values:
'center'(the default)'left''right'
Note
If
centeris not possible, aligns toright.- Return type:
- property rotation: int | float | Decimal | None
Text rotation in degrees. Defaults to
0Warning
Due to a more complex structure, backgrounds, borders and padding will be lost on a rotated data label.
- Return type:
numeric or
None
- property shadow: bool | ShadowOptions | None
Configuration for the shadow to apply to the data label box. Defaults to
False.If
False, no shadow is applied.
- property shape: str | None
The name of the symbol to use for the border around the label. Defaults to
'square'.Accepts:
'rect''square''circle''diamond''triangle''callout'
- property style: dict | str | None
CSS styling to apply to the annotation’s label.
The default color setting is
"contrast", which is a pseudo color that Highcharts picks up and applies the maximum contrast to the underlying point item, for example the bar in a bar chart.textOutlineis a pseudo property that applies an outline of the given width with the given color, which by default is the maximum contrast to the text. So a bright text color will result in a black text outline for maximum readability on a mixed background. In some cases, especially with grayscale text, the text outline doesn’t work well, in which cases it can be disabled by setting it to"none". WhenDataLabel.use_html()isTrue, thetextOutlinewill not be picked up. In this, case, the same effect can be acheived through thetext-shadowCSS property.For some series types, where each point has an extent, like for example tree maps, the data label may overflow the point. There are two strategies for handling overflow. By default, the text will wrap to multiple lines. The other strategy is to set
textOverflowto ellipsis, which will keep the text on one line plus it will break inside long words.
- property text_path: TextPath | None
Options for a label text which should follow marker’s shape.
Note
Border and background are disabled for a label that follows a path.
- property use_html: bool | None
If
True, will use HTML to render the data label. IfFalse, will use SVG or WebGL as applicable.Defaults to
False.
- property vertical_align: str | None
The vertical alignment of the annotation’s label. Defaults to
None.If
None, the alignment will depend on the data. For example, in a column chart, the label would be above positive values and below negative values.Accepts:
'bottom''middle''top'
- property x: int | float | Decimal | None
The x position offset of the label relative to the point. Defaults to
0.- Return type:
numeric or
None
class: SunburstDataLabel
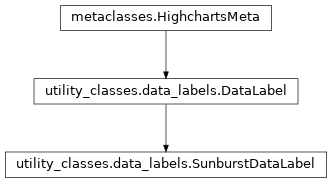
- class SunburstDataLabel(**kwargs)[source]
Variant of
DataLabelused for sunburst series.Class Inheritance
- copy(other=None, overwrite=True, **kwargs)
Copy the configuration settings from this instance to the
otherinstance.- Parameters:
other (
HighchartsMeta) – The target instance to which the properties of this instance should be copied. IfNone, will create a new instance and populate it with properties copied fromself. Defaults toNone.overwrite (
bool) – ifTrue, properties inotherthat are already set will be overwritten by their counterparts inself. Defaults toTrue.kwargs – Additional keyword arguments. Some special descendents of
HighchartsMetamay have special implementations of this method which rely on additional keyword arguments.
- Returns:
A mutated version of
otherwith new property values
- classmethod from_dict(as_dict: dict, allow_snake_case: bool = True)
Construct an instance of the class from a
dictobject.
- classmethod from_js_literal(as_str_or_file, allow_snake_case: bool = True, _break_loop_on_failure: bool = False)
Return a Python object representation of a Highcharts JavaScript object literal.
- Parameters:
as_str_or_file (
str) – The JavaScript object literal, represented either as astror as a filename which contains the JS object literal.allow_snake_case (
bool) – IfTrue, interpretssnake_casekeys as equivalent tocamelCasekeys. Defaults toTrue._break_loop_on_failure (
bool) – IfTrue, will break any looping operations in the event of a failure. Otherwise, will attempt to repair the failure. Defaults toFalse.
- Returns:
A Python object representation of the Highcharts JavaScript object literal.
- Return type:
HighchartsMeta
- classmethod from_json(as_json_or_file, allow_snake_case: bool = True)
Construct an instance of the class from a JSON string.
- Parameters:
as_json_or_file – The JSON string for the object or the filename of a file that contains the JSON string.
allow_snake_case (
bool) – IfTrue, interpretssnake_casekeys as equivalent tocamelCasekeys. Defaults toTrue.
- Returns:
A Python objcet representation of
as_json.- Return type:
HighchartsMeta
- get_required_modules(include_extension=False) List[str]
Return the list of URLs from which the Highcharts JavaScript modules needed to render the chart can be retrieved.
- to_dict() dict
Generate a
dictrepresentation of the object compatible with the Highcharts JavaScript library.Note
The
dictrepresentation has a property structure and naming convention that is intentionally consistent with the Highcharts JavaScript library. This is not Pythonic, but it makes managing the interplay between the two languages much, much simpler.
- to_js_literal(filename=None, encoding='utf-8', careful_validation=False) str | None
Return the object represented as a
strcontaining the JavaScript object literal.- Parameters:
along the way using the esprima-python library. Defaults to
False.Warning
Setting this value to
Truewill significantly degrade serialization performance, though it may prove useful for debugging purposes.
- to_json(filename=None, encoding='utf-8')
Generate a JSON string/byte string representation of the object compatible with the Highcharts JavaScript library.
Note
This method will either return a standard
stror abytesobject depending on the JSON serialization library you are using. For example, if your environment has orjson, the result will be abytesrepresentation of the string.- Parameters:
- Returns:
A JSON representation of the object compatible with the Highcharts library.
- Return type:
- static trim_dict(untrimmed: dict, to_json: bool = False, context: str = None) dict
Remove keys from
untrimmedwhose values areNoneand convert values that have.to_dict()methods.- Parameters:
untrimmed (
dict) – Thedictwhose values may still beNoneor Python objects.to_json (
bool) – IfTrue, will remove all keys fromuntrimmedthat are not serializable to JSON. Defaults toFalse.context (
strorNone) – If provided, will inform the method of the context in which it is being run which may inform special handling cases (e.g. where empty strings may be important / allowable). Defaults toNone.
- Returns:
Trimmed
dict- Return type:
- static trim_iterable(untrimmed, to_json=False, context: str = None)
Convert any
EnforcedNullTypevalues inuntrimmedto'null'.- Parameters:
untrimmed (iterable) – The iterable whose members may still be
Noneor Python objects.to_json (
bool) – IfTrue, will remove all members fromuntrimmedthat are not serializable to JSON. Defaults toFalse.context (
strorNone) – If provided, will inform the method of the context in which it is being run which may inform special handling cases (e.g. where empty strings may be important / allowable). Defaults toNone.
- Return type:
iterable
- property align: str | None
The alignment of the data label compared to the point. Defaults to
None.Accepts:
'left''center''right'
Hint
If right, the right side of the label should be touching the point.
- Returns:
The alignment of the annotation’s label.
- Return type:
- property allow_overlap: bool | None
If
True, data labels are allowed to overlap each other.Defaults to
False.Hint
To make the labels less sensitive for overlapping, the
DataLabel.padding()can be set to0.
- property animation: AnimationOptions | None
Enable or disable the initial animation for the data labels when a series is displayed.
The animation can also be set as a configuration object. Please note that this option only applies to the initial animation of the series itself. For other animations, see
Chart.animationand theanimationparameter under the (JavaScript) API methods. The following properties are supported:defer: The animation delay time in milliseconds.
Warning
Due to poor performance, animation is disabled in old IE browsers for several chart types.
- Return type:
AnimationOptionsorNone
- property background_color: str | Gradient | Pattern | None
The background color or gradient for the data label. Defaults to
None.
- property border_radius: int | float | Decimal | None
The border radius (in pixels) applied to the data label. Defaults to
0.- Returns:
The border radius to apply to the data label.
- Return type:
numeric or
None
- property border_width: int | float | Decimal | None
The border width (in pixels) applied to the data label. Defaults to
0.- Returns:
The border width to apply to the data label.
- Return type:
numeric or
None
- property class_name: str | None
A classname to apply styling using CSS. Defaults to
'highcharts-no-tooltip'.
- property color: str | None
The text color for the data labels. Defaults to
None.Note
For certain series types, like column or map, the data labels can be drawn inside the points. In this case the data label will be drawn with maximum contrast by default. Additionally, it will be given a
text-outlinestyle with the opposite color, to further increase the contrast. This can be overridden by setting thetext-outlinestyle tononein theDataLabel.style()setting.
- property crop: bool | None
If
True, hide part of the data label that falls outside the plot area. Defaults toFalse.Note
By default, the data label is moved inside the plot area as per the
DataLabel.overflow()setting.
- property defer: bool | int | None
Whether to defer displaying the data labels until the initial series animation has finished. If
None, behaves as if set toTrue.Setting to
Falserenders the data label immediately.If set to
Trueinherits the defer time set inPlotOptions.series.animation().If set to a number, defers the animation by that number of milliseconds.
- property enabled: bool | None
Enable or disable the data labels. Setting to
Nonebehaves as if set toFalse.
- property filter: Filter | None
A declarative filter to control of which data labels to display.
The declarative filter is designed for use when JavaScript callback functions are not available, like when the chart options require a pure JSON structure or for use with graphical editors. For programmatic control, use the
DataLabel.formatter()instead, and returnundefinedto disable a single data label.
- property formatter: CallbackFunction | None
JavaScript callback function to format the data label. Defaults to
None.Note
If a
DataLabel.format()is specified, the formatter will be ignored.- Returns:
A JavaScript callback function.
- Return type:
CallbackFunctionorNone
- property inside: bool | None
For points with an extent, like columns or map areas, whether to align the data label inside the box or to the actual value point. Defaults to
:obj:`None <python:None>`, which behaves like ``Falsein most cases butTruein stacked columns.
- property null_format: str | None
Format for points with the value of
null. Defaults toNone.Note
Works analogously to
DataLabel.format().Warning
Can only be applied only to series which support displaying null points.
- property null_formatter: CallbackFunction | None
JavaScript callback function to format the text of the data label for visible null points.
Note
Works analogously to
DataLabel.formatter().Warning
Can only be applied only to series which support displaying null points.
- Return type:
CallbackFunctionorNone
- property overflow: str | None
Configuration on how to handle a data label that overflows outside of the plot area. Defaults to
'justify', which aligns them inside the plot area. For columns and bars, this means the data label will be moved inside the bar.Hint
To display data labels outside the plot area, set
overflowto'allow'andDataLabel.crop()toFalse.Accepts:
'justify'- which forces the label back into the plot area'allow'- which allows data labels to overflow outside of the plot area
Note
The overflow treatment is also affected by the
DataLabel.crop()setting.
- property padding: int | None
The padding within the border box when either
DataLabel.border_width()orDataLabel.background_color()is set.Defaults to
5.
- property position: str | None
Aligns data labels relative to points. Defaults to
'center'.Accepts the following values:
'center'(the default)'left''right'
Note
If
centeris not possible, aligns toright.- Return type:
- property rotation: int | float | Decimal | None
Text rotation in degrees. Defaults to
0Warning
Due to a more complex structure, backgrounds, borders and padding will be lost on a rotated data label.
- Return type:
numeric or
None
- property rotation_mode: str | None
Determines how the data label will be rotated relative to the perimeter of the sunburst.
Valid values are:
'circular''auto''parallel''perpendicular'.
Defaults to
'circular'.Note
When
'circular', the best fit will be computed for the point, so that the label is curved around the center when there is room for it, otherwise perpendicular.The legacy
'auto'option works similiarly to'circular', but instead of curving the labels, they are tangented to the perimiter.Warning
The
.rotationproperty takes precedence over.rotation_mode.
- property shadow: bool | ShadowOptions | None
Configuration for the shadow to apply to the data label box. Defaults to
False.If
False, no shadow is applied.
- property shape: str | None
The name of the symbol to use for the border around the label. Defaults to
'square'.Accepts:
'rect''square''circle''diamond''triangle''callout'
- property style: dict | str | None
CSS styling to apply to the annotation’s label.
The default color setting is
"contrast", which is a pseudo color that Highcharts picks up and applies the maximum contrast to the underlying point item, for example the bar in a bar chart.textOutlineis a pseudo property that applies an outline of the given width with the given color, which by default is the maximum contrast to the text. So a bright text color will result in a black text outline for maximum readability on a mixed background. In some cases, especially with grayscale text, the text outline doesn’t work well, in which cases it can be disabled by setting it to"none". WhenDataLabel.use_html()isTrue, thetextOutlinewill not be picked up. In this, case, the same effect can be acheived through thetext-shadowCSS property.For some series types, where each point has an extent, like for example tree maps, the data label may overflow the point. There are two strategies for handling overflow. By default, the text will wrap to multiple lines. The other strategy is to set
textOverflowto ellipsis, which will keep the text on one line plus it will break inside long words.
- property text_path: TextPath | None
Options for a label text which should follow marker’s shape.
Note
Border and background are disabled for a label that follows a path.
- property use_html: bool | None
If
True, will use HTML to render the data label. IfFalse, will use SVG or WebGL as applicable.Defaults to
False.
- property vertical_align: str | None
The vertical alignment of the annotation’s label. Defaults to
None.If
None, the alignment will depend on the data. For example, in a column chart, the label would be above positive values and below negative values.Accepts:
'bottom''middle''top'
- property x: int | float | Decimal | None
The x position offset of the label relative to the point. Defaults to
0.- Return type:
numeric or
None
class: NodeDataLabel
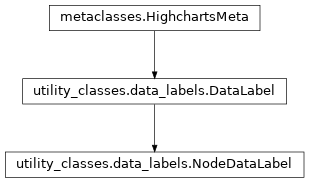
- class NodeDataLabel(**kwargs)[source]
Variant of
DataLabelused for node-based charts/diagrams.Class Inheritance
- copy(other=None, overwrite=True, **kwargs)
Copy the configuration settings from this instance to the
otherinstance.- Parameters:
other (
HighchartsMeta) – The target instance to which the properties of this instance should be copied. IfNone, will create a new instance and populate it with properties copied fromself. Defaults toNone.overwrite (
bool) – ifTrue, properties inotherthat are already set will be overwritten by their counterparts inself. Defaults toTrue.kwargs – Additional keyword arguments. Some special descendents of
HighchartsMetamay have special implementations of this method which rely on additional keyword arguments.
- Returns:
A mutated version of
otherwith new property values
- classmethod from_dict(as_dict: dict, allow_snake_case: bool = True)
Construct an instance of the class from a
dictobject.
- classmethod from_js_literal(as_str_or_file, allow_snake_case: bool = True, _break_loop_on_failure: bool = False)
Return a Python object representation of a Highcharts JavaScript object literal.
- Parameters:
as_str_or_file (
str) – The JavaScript object literal, represented either as astror as a filename which contains the JS object literal.allow_snake_case (
bool) – IfTrue, interpretssnake_casekeys as equivalent tocamelCasekeys. Defaults toTrue._break_loop_on_failure (
bool) – IfTrue, will break any looping operations in the event of a failure. Otherwise, will attempt to repair the failure. Defaults toFalse.
- Returns:
A Python object representation of the Highcharts JavaScript object literal.
- Return type:
HighchartsMeta
- classmethod from_json(as_json_or_file, allow_snake_case: bool = True)
Construct an instance of the class from a JSON string.
- Parameters:
as_json_or_file – The JSON string for the object or the filename of a file that contains the JSON string.
allow_snake_case (
bool) – IfTrue, interpretssnake_casekeys as equivalent tocamelCasekeys. Defaults toTrue.
- Returns:
A Python objcet representation of
as_json.- Return type:
HighchartsMeta
- get_required_modules(include_extension=False) List[str]
Return the list of URLs from which the Highcharts JavaScript modules needed to render the chart can be retrieved.
- to_dict() dict
Generate a
dictrepresentation of the object compatible with the Highcharts JavaScript library.Note
The
dictrepresentation has a property structure and naming convention that is intentionally consistent with the Highcharts JavaScript library. This is not Pythonic, but it makes managing the interplay between the two languages much, much simpler.
- to_js_literal(filename=None, encoding='utf-8', careful_validation=False) str | None
Return the object represented as a
strcontaining the JavaScript object literal.- Parameters:
along the way using the esprima-python library. Defaults to
False.Warning
Setting this value to
Truewill significantly degrade serialization performance, though it may prove useful for debugging purposes.
- to_json(filename=None, encoding='utf-8')
Generate a JSON string/byte string representation of the object compatible with the Highcharts JavaScript library.
Note
This method will either return a standard
stror abytesobject depending on the JSON serialization library you are using. For example, if your environment has orjson, the result will be abytesrepresentation of the string.- Parameters:
- Returns:
A JSON representation of the object compatible with the Highcharts library.
- Return type:
- static trim_dict(untrimmed: dict, to_json: bool = False, context: str = None) dict
Remove keys from
untrimmedwhose values areNoneand convert values that have.to_dict()methods.- Parameters:
untrimmed (
dict) – Thedictwhose values may still beNoneor Python objects.to_json (
bool) – IfTrue, will remove all keys fromuntrimmedthat are not serializable to JSON. Defaults toFalse.context (
strorNone) – If provided, will inform the method of the context in which it is being run which may inform special handling cases (e.g. where empty strings may be important / allowable). Defaults toNone.
- Returns:
Trimmed
dict- Return type:
- static trim_iterable(untrimmed, to_json=False, context: str = None)
Convert any
EnforcedNullTypevalues inuntrimmedto'null'.- Parameters:
untrimmed (iterable) – The iterable whose members may still be
Noneor Python objects.to_json (
bool) – IfTrue, will remove all members fromuntrimmedthat are not serializable to JSON. Defaults toFalse.context (
strorNone) – If provided, will inform the method of the context in which it is being run which may inform special handling cases (e.g. where empty strings may be important / allowable). Defaults toNone.
- Return type:
iterable
- property align: str | None
The alignment of the data label compared to the point. Defaults to
None.Accepts:
'left''center''right'
Hint
If right, the right side of the label should be touching the point.
- Returns:
The alignment of the annotation’s label.
- Return type:
- property allow_overlap: bool | None
If
True, data labels are allowed to overlap each other.Defaults to
False.Hint
To make the labels less sensitive for overlapping, the
DataLabel.padding()can be set to0.
- property animation: AnimationOptions | None
Enable or disable the initial animation for the data labels when a series is displayed.
The animation can also be set as a configuration object. Please note that this option only applies to the initial animation of the series itself. For other animations, see
Chart.animationand theanimationparameter under the (JavaScript) API methods. The following properties are supported:defer: The animation delay time in milliseconds.
Warning
Due to poor performance, animation is disabled in old IE browsers for several chart types.
- Return type:
AnimationOptionsorNone
- property background_color: str | Gradient | Pattern | None
The background color or gradient for the data label. Defaults to
None.
- property border_radius: int | float | Decimal | None
The border radius (in pixels) applied to the data label. Defaults to
0.- Returns:
The border radius to apply to the data label.
- Return type:
numeric or
None
- property border_width: int | float | Decimal | None
The border width (in pixels) applied to the data label. Defaults to
0.- Returns:
The border width to apply to the data label.
- Return type:
numeric or
None
- property class_name: str | None
A classname to apply styling using CSS. Defaults to
'highcharts-no-tooltip'.
- property color: str | None
The text color for the data labels. Defaults to
None.Note
For certain series types, like column or map, the data labels can be drawn inside the points. In this case the data label will be drawn with maximum contrast by default. Additionally, it will be given a
text-outlinestyle with the opposite color, to further increase the contrast. This can be overridden by setting thetext-outlinestyle tononein theDataLabel.style()setting.
- property crop: bool | None
If
True, hide part of the data label that falls outside the plot area. Defaults toFalse.Note
By default, the data label is moved inside the plot area as per the
DataLabel.overflow()setting.
- property defer: bool | int | None
Whether to defer displaying the data labels until the initial series animation has finished. If
None, behaves as if set toTrue.Setting to
Falserenders the data label immediately.If set to
Trueinherits the defer time set inPlotOptions.series.animation().If set to a number, defers the animation by that number of milliseconds.
- property enabled: bool | None
Enable or disable the data labels. Setting to
Nonebehaves as if set toFalse.
- property filter: Filter | None
A declarative filter to control of which data labels to display.
The declarative filter is designed for use when JavaScript callback functions are not available, like when the chart options require a pure JSON structure or for use with graphical editors. For programmatic control, use the
DataLabel.formatter()instead, and returnundefinedto disable a single data label.
- property formatter: CallbackFunction | None
JavaScript callback function to format the data label. Defaults to
None.Note
If a
DataLabel.format()is specified, the formatter will be ignored.- Returns:
A JavaScript callback function.
- Return type:
CallbackFunctionorNone
- property inside: bool | None
For points with an extent, like columns or map areas, whether to align the data label inside the box or to the actual value point. Defaults to
:obj:`None <python:None>`, which behaves like ``Falsein most cases butTruein stacked columns.
- property node_format: str | None
The format string which determines what to render for nodes in a sankey, organization, or similar diagram. Defaults to
None.
- property node_formatter: CallbackFunction | None
JavaScript callback function to format data labels for nodes in a sankey or organization diagram. Defaults to
None.Note
The
node_formattakes precedence over thenode_formatter.- Return type:
CallbackFunctionorNone
- property null_format: str | None
Format for points with the value of
null. Defaults toNone.Note
Works analogously to
DataLabel.format().Warning
Can only be applied only to series which support displaying null points.
- property null_formatter: CallbackFunction | None
JavaScript callback function to format the text of the data label for visible null points.
Note
Works analogously to
DataLabel.formatter().Warning
Can only be applied only to series which support displaying null points.
- Return type:
CallbackFunctionorNone
- property overflow: str | None
Configuration on how to handle a data label that overflows outside of the plot area. Defaults to
'justify', which aligns them inside the plot area. For columns and bars, this means the data label will be moved inside the bar.Hint
To display data labels outside the plot area, set
overflowto'allow'andDataLabel.crop()toFalse.Accepts:
'justify'- which forces the label back into the plot area'allow'- which allows data labels to overflow outside of the plot area
Note
The overflow treatment is also affected by the
DataLabel.crop()setting.
- property padding: int | None
The padding within the border box when either
DataLabel.border_width()orDataLabel.background_color()is set.Defaults to
5.
- property position: str | None
Aligns data labels relative to points. Defaults to
'center'.Accepts the following values:
'center'(the default)'left''right'
Note
If
centeris not possible, aligns toright.- Return type:
- property rotation: int | float | Decimal | None
Text rotation in degrees. Defaults to
0Warning
Due to a more complex structure, backgrounds, borders and padding will be lost on a rotated data label.
- Return type:
numeric or
None
- property shadow: bool | ShadowOptions | None
Configuration for the shadow to apply to the data label box. Defaults to
False.If
False, no shadow is applied.
- property shape: str | None
The name of the symbol to use for the border around the label. Defaults to
'square'.Accepts:
'rect''square''circle''diamond''triangle''callout'
- property style: dict | str | None
CSS styling to apply to the annotation’s label.
The default color setting is
"contrast", which is a pseudo color that Highcharts picks up and applies the maximum contrast to the underlying point item, for example the bar in a bar chart.textOutlineis a pseudo property that applies an outline of the given width with the given color, which by default is the maximum contrast to the text. So a bright text color will result in a black text outline for maximum readability on a mixed background. In some cases, especially with grayscale text, the text outline doesn’t work well, in which cases it can be disabled by setting it to"none". WhenDataLabel.use_html()isTrue, thetextOutlinewill not be picked up. In this, case, the same effect can be acheived through thetext-shadowCSS property.For some series types, where each point has an extent, like for example tree maps, the data label may overflow the point. There are two strategies for handling overflow. By default, the text will wrap to multiple lines. The other strategy is to set
textOverflowto ellipsis, which will keep the text on one line plus it will break inside long words.
- property text_path: TextPath | None
Options for a label text which should follow marker’s shape.
Note
Border and background are disabled for a label that follows a path.
- property use_html: bool | None
If
True, will use HTML to render the data label. IfFalse, will use SVG or WebGL as applicable.Defaults to
False.
- property vertical_align: str | None
The vertical alignment of the annotation’s label. Defaults to
None.If
None, the alignment will depend on the data. For example, in a column chart, the label would be above positive values and below negative values.Accepts:
'bottom''middle''top'
- property x: int | float | Decimal | None
The x position offset of the label relative to the point. Defaults to
0.- Return type:
numeric or
None
class: Filter
- class Filter(**kwargs)[source]
A declarative filter to control of which data labels to display.
The declarative filter is designed for use when JavaScript callback functions are not available, like when the chart options require a pure JSON structure or for use with graphical editors. For programmatic control, use the
DataLabel.formatter()instead, and returnundefinedto disable a single data label.Class Inheritance
- copy(other=None, overwrite=True, **kwargs)
Copy the configuration settings from this instance to the
otherinstance.- Parameters:
other (
HighchartsMeta) – The target instance to which the properties of this instance should be copied. IfNone, will create a new instance and populate it with properties copied fromself. Defaults toNone.overwrite (
bool) – ifTrue, properties inotherthat are already set will be overwritten by their counterparts inself. Defaults toTrue.kwargs – Additional keyword arguments. Some special descendents of
HighchartsMetamay have special implementations of this method which rely on additional keyword arguments.
- Returns:
A mutated version of
otherwith new property values
- classmethod from_dict(as_dict: dict, allow_snake_case: bool = True)
Construct an instance of the class from a
dictobject.
- classmethod from_js_literal(as_str_or_file, allow_snake_case: bool = True, _break_loop_on_failure: bool = False)
Return a Python object representation of a Highcharts JavaScript object literal.
- Parameters:
as_str_or_file (
str) – The JavaScript object literal, represented either as astror as a filename which contains the JS object literal.allow_snake_case (
bool) – IfTrue, interpretssnake_casekeys as equivalent tocamelCasekeys. Defaults toTrue._break_loop_on_failure (
bool) – IfTrue, will break any looping operations in the event of a failure. Otherwise, will attempt to repair the failure. Defaults toFalse.
- Returns:
A Python object representation of the Highcharts JavaScript object literal.
- Return type:
HighchartsMeta
- classmethod from_json(as_json_or_file, allow_snake_case: bool = True)
Construct an instance of the class from a JSON string.
- Parameters:
as_json_or_file – The JSON string for the object or the filename of a file that contains the JSON string.
allow_snake_case (
bool) – IfTrue, interpretssnake_casekeys as equivalent tocamelCasekeys. Defaults toTrue.
- Returns:
A Python objcet representation of
as_json.- Return type:
HighchartsMeta
- get_required_modules(include_extension=False) List[str]
Return the list of URLs from which the Highcharts JavaScript modules needed to render the chart can be retrieved.
- to_dict() dict
Generate a
dictrepresentation of the object compatible with the Highcharts JavaScript library.Note
The
dictrepresentation has a property structure and naming convention that is intentionally consistent with the Highcharts JavaScript library. This is not Pythonic, but it makes managing the interplay between the two languages much, much simpler.
- to_js_literal(filename=None, encoding='utf-8', careful_validation=False) str | None
Return the object represented as a
strcontaining the JavaScript object literal.- Parameters:
along the way using the esprima-python library. Defaults to
False.Warning
Setting this value to
Truewill significantly degrade serialization performance, though it may prove useful for debugging purposes.
- to_json(filename=None, encoding='utf-8')
Generate a JSON string/byte string representation of the object compatible with the Highcharts JavaScript library.
Note
This method will either return a standard
stror abytesobject depending on the JSON serialization library you are using. For example, if your environment has orjson, the result will be abytesrepresentation of the string.- Parameters:
- Returns:
A JSON representation of the object compatible with the Highcharts library.
- Return type:
- static trim_dict(untrimmed: dict, to_json: bool = False, context: str = None) dict
Remove keys from
untrimmedwhose values areNoneand convert values that have.to_dict()methods.- Parameters:
untrimmed (
dict) – Thedictwhose values may still beNoneor Python objects.to_json (
bool) – IfTrue, will remove all keys fromuntrimmedthat are not serializable to JSON. Defaults toFalse.context (
strorNone) – If provided, will inform the method of the context in which it is being run which may inform special handling cases (e.g. where empty strings may be important / allowable). Defaults toNone.
- Returns:
Trimmed
dict- Return type:
- static trim_iterable(untrimmed, to_json=False, context: str = None)
Convert any
EnforcedNullTypevalues inuntrimmedto'null'.- Parameters:
untrimmed (iterable) – The iterable whose members may still be
Noneor Python objects.to_json (
bool) – IfTrue, will remove all members fromuntrimmedthat are not serializable to JSON. Defaults toFalse.context (
strorNone) – If provided, will inform the method of the context in which it is being run which may inform special handling cases (e.g. where empty strings may be important / allowable). Defaults toNone.
- Return type:
iterable
- property operator: str | None
The operator to compare by. Defaults to
None.Accepts:
'>''<''>=''<=''==''==='