.options
.accessibility.annotations.axes.boost.caption.chart.scrollable_plot_area.data.defs.drilldown.exporting.legend.loading.navigation.navigator.no_data.pane.plot_options.abands.accessibility.ad.arcdiagram.area.aroon.atr.averages.bar.base.bellcurve.boxplot.bubble.bullet.candlestick.data_sorting.dependencywheel.disparity_index.dmi.drag_drop.dumbbell.flags.funnel.gauge.generic.heatmap.histogram.hlc.indicators.item.levels.linear_regressions.link.momentum.networkgraph.organization.oscillators.packedbubble.pareto.pictorial.pie.pivot_points.points.polygon.price_envelopes.psar.pyramid.sankey.scatter.series.sonification.spline.sunburst.timeline.treegraph.treemap.vbp.vector.venn.wordcloud.zigzag
.responsive.series.abands.ad.arcdiagram.area.aroon.atr.averages.bar.base.bellcurve.boxplot.bubble.bullet.candlestick.data.dependencywheel.disparity_index.dmi.dumbbell.flags.funnel.gauge.Heatmap.histogram.hlc.item.labels.linear_regressions.momentum.networkgraph.oscillators.organization.packedbubble.pareto.pictorial.pie.pivot_points.polygon.price_envelopes.psar.pyramid.sankey.scatter.series_generator.spline.sunburst.timeline.treegraph.treemap.vbp.vector.venn.wordcloud.zigzag
.options.sonification.stock_tools.subtitle.time.title.tooltips
class: HighchartsMaOptions
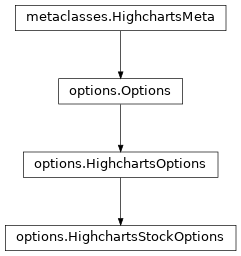
- class HighchartsStockOptions(**kwargs)[source]
The Python representation of the Highcharts Stock configuration object.
Class Inheritance
- add_series(*series)
Adds
seriesto theseriesproperty.- Parameters:
series (one or more
SeriesBaseor coercable) – One or more series instances (descended fromSeriesBase) or an instance (e.g.dict,str, etc.) coercable to one
- copy(other=None, overwrite=True, **kwargs)
Copy the configuration settings from this instance to the
otherinstance.- Parameters:
other (
HighchartsMeta) – The target instance to which the properties of this instance should be copied. IfNone, will create a new instance and populate it with properties copied fromself. Defaults toNone.overwrite (
bool) – ifTrue, properties inotherthat are already set will be overwritten by their counterparts inself. Defaults toTrue.kwargs – Additional keyword arguments. Some special descendents of
HighchartsMetamay have special implementations of this method which rely on additional keyword arguments.
- Returns:
A mutated version of
otherwith new property values
- classmethod from_dict(as_dict: dict, allow_snake_case: bool = True)
Construct an instance of the class from a
dictobject.
- classmethod from_js_literal(as_str_or_file, allow_snake_case: bool = True, _break_loop_on_failure: bool = False)
Return a Python object representation of a Highcharts JavaScript object literal.
- Parameters:
as_str_or_file (
str) – The JavaScript object literal, represented either as astror as a filename which contains the JS object literal.allow_snake_case (
bool) – IfTrue, interpretssnake_casekeys as equivalent tocamelCasekeys. Defaults toTrue._break_loop_on_failure (
bool) – IfTrue, will break any looping operations in the event of a failure. Otherwise, will attempt to repair the failure. Defaults toFalse.
- Returns:
A Python object representation of the Highcharts JavaScript object literal.
- Return type:
HighchartsMeta
- classmethod from_json(as_json_or_file, allow_snake_case: bool = True)
Construct an instance of the class from a JSON string.
- Parameters:
as_json_or_file – The JSON string for the object or the filename of a file that contains the JSON string.
allow_snake_case (
bool) – IfTrue, interpretssnake_casekeys as equivalent tocamelCasekeys. Defaults toTrue.
- Returns:
A Python objcet representation of
as_json.- Return type:
HighchartsMeta
- classmethod from_series(*series, kwargs=None)
Creates a new
Optionsinstance populated withseries.- Parameters:
series (one or more
SeriesBaseor coercable) – One or more series instances (descended fromSeriesBase) or an instance (e.g.dict,str, etc.) coercable to onekwargs (
dict) –Other properties to use as keyword arguments for the instance to be created.
Warning
If
kwargssets the.seriesproperty, that setting will be overridden by the contents ofseries.
- Returns:
A new
Optionsinstance- Return type:
- get_required_modules(include_extension=False) List[str]
Return the list of URLs from which the Highcharts JavaScript modules needed to render the chart can be retrieved.
- to_dict() dict
Generate a
dictrepresentation of the object compatible with the Highcharts JavaScript library.Note
The
dictrepresentation has a property structure and naming convention that is intentionally consistent with the Highcharts JavaScript library. This is not Pythonic, but it makes managing the interplay between the two languages much, much simpler.
- to_js_literal(filename=None, encoding='utf-8', careful_validation=False) str | None
Return the object represented as a
strcontaining the JavaScript object literal.- Parameters:
along the way using the esprima-python library. Defaults to
False.Warning
Setting this value to
Truewill significantly degrade serialization performance, though it may prove useful for debugging purposes.
- to_json(filename=None, encoding='utf-8')
Generate a JSON string/byte string representation of the object compatible with the Highcharts JavaScript library.
Note
This method will either return a standard
stror abytesobject depending on the JSON serialization library you are using. For example, if your environment has orjson, the result will be abytesrepresentation of the string.- Parameters:
- Returns:
A JSON representation of the object compatible with the Highcharts library.
- Return type:
- static trim_dict(untrimmed: dict, to_json: bool = False, context: str = None) dict
Remove keys from
untrimmedwhose values areNoneand convert values that have.to_dict()methods.- Parameters:
untrimmed (
dict) – Thedictwhose values may still beNoneor Python objects.to_json (
bool) – IfTrue, will remove all keys fromuntrimmedthat are not serializable to JSON. Defaults toFalse.context (
strorNone) – If provided, will inform the method of the context in which it is being run which may inform special handling cases (e.g. where empty strings may be important / allowable). Defaults toNone.
- Returns:
Trimmed
dict- Return type:
- static trim_iterable(untrimmed, to_json=False, context: str = None)
Convert any
EnforcedNullTypevalues inuntrimmedto'null'.- Parameters:
untrimmed (iterable) – The iterable whose members may still be
Noneor Python objects.to_json (
bool) – IfTrue, will remove all members fromuntrimmedthat are not serializable to JSON. Defaults toFalse.context (
strorNone) – If provided, will inform the method of the context in which it is being run which may inform special handling cases (e.g. where empty strings may be important / allowable). Defaults toNone.
- Return type:
iterable
- property accessibility: Accessibility | None
Options for configuring accessibility for the chart.
Note
Requires the accessibility module to be loaded in the browser. For a description of the module and information on its features, see Highcharts Accessibility.
- Returns:
The accessibility configuration for the chart or
None- Return type:
Accessibility/None- Raises:
HighchartsError – if setting the value to an incompatible type
- property annotations: List[Annotation] | None
A basic type of an annotation. It allows adding custom labels or shapes. The items can be tied to points, axis coordinates or chart pixel coordinates.
- property boost: Boost | None
Options for the Boost module.
The Boost module allows certain series types to be rendered by WebGL instead of the default SVG. This allows hundreds of thousands of data points to be rendered in milliseconds. In addition to the WebGL rendering it saves time by skipping processing and inspection of the data wherever possible.
Warning
This introduces some limitations to what features are available in boost mode. See the docs for details.
- Returns:
The
Boostobject.- Return type:
Boost
- property caption: Caption | None
The chart’s caption, which will render below the chart and will be part of exported charts.
Note
The caption can be updated after chart initialization through the
Chart.updateorChart.caption.updateJavaScript methods.
- property chart: ChartOptions | None
General options for the chart.
Note
This property is perhaps one of the most important properties you will use when configuring your Highcharts data visualization.
- property color_axis: List[ColorAxis] | None
A color axis for series.
Visually, the color axis will appear as a gradient or as separate items inside the legend, depending on whether the axis is scalar or based on data classes.
A scalar color axis is represented by a gradient. The colors either range between the
minimum_colorand themaximum_color, or for more fine grained control the colors can be defined in stops. Often times, the color axis needs to be adjusted to get the right color spread for the data. In addition to stops, consider using a logarithmic axis type, or setting min and max to avoid the colors being determined by outliers.For supported color formats, please see the documentation article about colors.
When data_classes are used, the ranges are subdivided into separate classes like categories based on their values. This can be used for ranges between two values, but also for a true category. However, when your data is categorized, it may be as convenient to add each category to a separate series.
Warning
Color axis does not work with:
sankey,sunburst,dependencywheel,networkgraph,wordcloud,venn,gaugeandsolidgaugeseries types.See the Axis object for programmatic access to the axis.
- property colors: List[str | Gradient | Pattern] | None
An array containing the default colors for the chart’s series.
When all colors are used, new colors are pulled from the start again.
Default colors can also be set on a series or
series.typebasis, see Column.colors and Pie.colors.Warning
In styled mode, the colors option does not exist.
Instead, colors are defined in CSS and applied either through series or point class names, or through the Chart.color_count option.
Defaults to:
[
    "#7cb5ec",
    "#434348",
    "#90ed7d",
    "#f7a35c",
    "#8085e9",
    "#f15c80",
    "#e4d354",
    "#2b908f",
    "#f45b5b",
    "#91e8e1"
]
- property credits: Credits | None
Highchart by default puts a credits label in the lower right corner of the chart. This can be changed using these options.
- property data: Data | None
The
dataproperty provides a simplified interface for adding data to a chart from sources like CVS, HTML tables, or grid views. See also the tutorial article on the Data module.Warning
It requires the
modules/data.jsfile to be loaded in the browser / client.Warning
Please note that the default way of adding data in Highcharts, without the need of a module, is through the
series.type.dataproperty.
- property defs: MarkerDefinition | None
Options for configuring markers for annotations.
- property drilldown: Drilldown | None
Options to configure drilldown functionality in the chart, which enables users to inspect increasingly high resolution data by clicking on chart items like columns or pie slices.
Note
The drilldown feature requires the
drilldown.jsfile to be loaded in the browser/client. This file is found in the modules directory of the download package, or online at code.highcharts.com/modules/drilldown.js.- Returns:
The options to configure the chart’s drill down functionality.
- Return type:
DrilldownorNone
- property exporting: Exporting | None
Options to configure the export functionality enabled for the chart.
- Returns:
The configuration of the chart’s exporting functionality.
- Return type:
ExportingorNone
- property language: Language | None
Language object which can be used to configure the specific text to use in the chart.
Note
When working in JavaScript, the
langconfiguration is global and it can’t be set on each chart initialization.Instead, use
Highcharts.setOptions()to set it before any chart is initialized.
- property legend: Legend | None
The legend is a box containing a symbol and name for each series item or point item in the chart. Each series (or points in case of pie charts) is represented by a symbol and its name in the legend.
See also
It is possible to override the symbol creator function and create custom legend symbols.
- property loading: Loading | None
The loading options control the appearance of the loading screen that covers the plot area on chart operations.
This screen only appears after an explicit call to
chart.showLoading()in the browser. It is a utility for developers to communicate to the end user that something is going on, for example while retrieving new data via an XHR connection.Hint
The “Loading…” text itself is not part of this configuration object, but is instead part of the
.languageconfiguration.
A collection of options for buttons and menus appearing in the exporting module or in Stock Tools.
- Returns:
The configuration of the navigation buttons.
- Return type:
;class:Navigation or
None
The navigator is a small series below the main series, displaying a view of the entire data set. It provides tools to zoom in and out on parts of the data as well as panning across the dataset.
- Returns:
Configuration instructions for the
Navigatorfunctionality.- Return type:
NavigatororNone
- property no_data: NoData | None
Options for displaying a message like “No data to display”.
Warning
This feature requires the file
no-data-to-display.jsto be loaded in the page.Tip
The actual text to display is set in the
languageoptions.- Returns:
Configuration of how to display a no data message.
- Return type:
NoDataorNone
- property pane: Pane | None
The pane serves as a container for axes and backgrounds for circular gauges and polar charts.
- Returns:
The Pane configuration options.
- Return type:
PaneorNone
- property plot_options: PlotOptions | None
A wrapper object for configurations applied to each series type.
The config objects for each series can also be overridden for each series item as given in the series array.
Configuration options for the series are given in three levels:
Options for all series in a chart are given in the
seriesproperty.Options for all series of a specific type are given in the corresponding property for that type, for example
plot_options.line.Finally, options for one single series are given in the
seriesarray.
- Returns:
Configurations for how series should be plotted / displayed.
- Return type:
PlotOptionsorNone
- property range_selector: RangeSelector | None
The range selector is a tool for selecting ranges to display within the chart. It provides buttons to select preconfigured ranges in the chart, like 1 day, 1 week, 1 month etc. It also provides input boxes where min and max dates can be manually input.
- Returns:
Configuration instructions for the Range Selector functionality.
- Return type:
RangeSelectororNone
- property responsive: Responsive | None
Rules to apply for different screen or chart sizes.
Note
Each rule specifies additional chart options.
- Returns:
Rules to apply for different screen or chart sizes.
- Return type:
ResponsiveorNone
- property scrollbar: Scrollbar | None
The scrollbar is a means of panning over the X axis of a stock chart.
Note
Scrollbars can also be applied to other types of axes.
Note
Another approach to scrollable charts is the
Chart.scrollable_plot_area()option that is especially suitable for simpler cartesian charts on mobile.In styled mode, all the presentational options for the scrollbar are replaced by the classes
.highcharts-scrollbar-thumb,.highcharts-scrollbar-arrow,.highcharts-scrollbar-button,.highcharts-scrollbar-riflesand.highcharts-scrollbar-track.- Returns:
The configuration options for the Scrollbar functionality.
- Return type:
ScrollbarorNone
- property series: List[GenericTypeOptions] | None
Series options for specific data and the data itself.
- Returns:
The series to display along with configuration and data.
- Return type:
SeriesorNone
- property sonification: SonificationOptions | None
Configuration of global sonification settings for the entire chart.
- Return type:
- property stock_tools: StockTools | None
Configure the stockTools GUI strings in the chart.
Warning
Requires the stockTools module <https://api.highcharts.com/highstock/>`_ to be loaded in the client/browser.
See also
For a description of the module and information on its features, see Highcharts StockTools.
- Returns:
The configuration options for the StockTools functionality.
- Return type:
StockToolsorNone
- property subtitle: Subtitle | None
The chart’s subtitle.
Note
This can be used both to display a subtitle below the main title, and to display random text anywhere in the chart.
Warning
The subtitle can be updated after chart initialization through the
Chart.setTitleJavaScript method.- Returns:
Configuration of the chart’s subtitle.
- Return type:
SubtitleorNone
- property time: Time | None
Time options that can apply globally or to individual charts. These settings affect how datetime axes are laid out, how tooltips are formatted, how series
point_interval_unit <Series.point_interval_unit()works and how the Highcharts Stock range selector handles time.- Returns:
Configuration of applicable Time options.
- Return type:
TimeorNone
- property title: Title | None
Options for configuring the chart’s main title.
- Returns:
Configuration of the chart’s main title.
- Return type:
TitleorNone
- property tooltip: Tooltip | None
Options for the tooltip that appears when the user hovers over a series or point.
- Returns:
Configuration settings for tooltips to display above the chart.
- Return type:
TooltiporNone
- property x_axis: List[XAxis] | None
The X axis or category axis.
Normally this is the horizontal axis, though if the chart is inverted this is the vertical axis.
class: HighchartsOptions
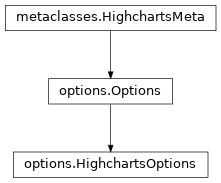
- class HighchartsOptions(**kwargs)[source]
The Python representation of the Highcharts
optionsconfiguration object.Class Inheritance
- add_series(*series)
Adds
seriesto theseriesproperty.- Parameters:
series (one or more
SeriesBaseor coercable) – One or more series instances (descended fromSeriesBase) or an instance (e.g.dict,str, etc.) coercable to one
- copy(other=None, overwrite=True, **kwargs)
Copy the configuration settings from this instance to the
otherinstance.- Parameters:
other (
HighchartsMeta) – The target instance to which the properties of this instance should be copied. IfNone, will create a new instance and populate it with properties copied fromself. Defaults toNone.overwrite (
bool) – ifTrue, properties inotherthat are already set will be overwritten by their counterparts inself. Defaults toTrue.kwargs – Additional keyword arguments. Some special descendents of
HighchartsMetamay have special implementations of this method which rely on additional keyword arguments.
- Returns:
A mutated version of
otherwith new property values
- classmethod from_dict(as_dict: dict, allow_snake_case: bool = True)
Construct an instance of the class from a
dictobject.
- classmethod from_js_literal(as_str_or_file, allow_snake_case: bool = True, _break_loop_on_failure: bool = False)
Return a Python object representation of a Highcharts JavaScript object literal.
- Parameters:
as_str_or_file (
str) – The JavaScript object literal, represented either as astror as a filename which contains the JS object literal.allow_snake_case (
bool) – IfTrue, interpretssnake_casekeys as equivalent tocamelCasekeys. Defaults toTrue._break_loop_on_failure (
bool) – IfTrue, will break any looping operations in the event of a failure. Otherwise, will attempt to repair the failure. Defaults toFalse.
- Returns:
A Python object representation of the Highcharts JavaScript object literal.
- Return type:
HighchartsMeta
- classmethod from_json(as_json_or_file, allow_snake_case: bool = True)
Construct an instance of the class from a JSON string.
- Parameters:
as_json_or_file – The JSON string for the object or the filename of a file that contains the JSON string.
allow_snake_case (
bool) – IfTrue, interpretssnake_casekeys as equivalent tocamelCasekeys. Defaults toTrue.
- Returns:
A Python objcet representation of
as_json.- Return type:
HighchartsMeta
- classmethod from_series(*series, kwargs=None)
Creates a new
Optionsinstance populated withseries.- Parameters:
series (one or more
SeriesBaseor coercable) – One or more series instances (descended fromSeriesBase) or an instance (e.g.dict,str, etc.) coercable to onekwargs (
dict) –Other properties to use as keyword arguments for the instance to be created.
Warning
If
kwargssets the.seriesproperty, that setting will be overridden by the contents ofseries.
- Returns:
A new
Optionsinstance- Return type:
- get_required_modules(include_extension=False) List[str]
Return the list of URLs from which the Highcharts JavaScript modules needed to render the chart can be retrieved.
- to_dict() dict
Generate a
dictrepresentation of the object compatible with the Highcharts JavaScript library.Note
The
dictrepresentation has a property structure and naming convention that is intentionally consistent with the Highcharts JavaScript library. This is not Pythonic, but it makes managing the interplay between the two languages much, much simpler.
- to_js_literal(filename=None, encoding='utf-8', careful_validation=False) str | None
Return the object represented as a
strcontaining the JavaScript object literal.- Parameters:
along the way using the esprima-python library. Defaults to
False.Warning
Setting this value to
Truewill significantly degrade serialization performance, though it may prove useful for debugging purposes.
- to_json(filename=None, encoding='utf-8')
Generate a JSON string/byte string representation of the object compatible with the Highcharts JavaScript library.
Note
This method will either return a standard
stror abytesobject depending on the JSON serialization library you are using. For example, if your environment has orjson, the result will be abytesrepresentation of the string.- Parameters:
- Returns:
A JSON representation of the object compatible with the Highcharts library.
- Return type:
- static trim_dict(untrimmed: dict, to_json: bool = False, context: str = None) dict
Remove keys from
untrimmedwhose values areNoneand convert values that have.to_dict()methods.- Parameters:
untrimmed (
dict) – Thedictwhose values may still beNoneor Python objects.to_json (
bool) – IfTrue, will remove all keys fromuntrimmedthat are not serializable to JSON. Defaults toFalse.context (
strorNone) – If provided, will inform the method of the context in which it is being run which may inform special handling cases (e.g. where empty strings may be important / allowable). Defaults toNone.
- Returns:
Trimmed
dict- Return type:
- static trim_iterable(untrimmed, to_json=False, context: str = None)
Convert any
EnforcedNullTypevalues inuntrimmedto'null'.- Parameters:
untrimmed (iterable) – The iterable whose members may still be
Noneor Python objects.to_json (
bool) – IfTrue, will remove all members fromuntrimmedthat are not serializable to JSON. Defaults toFalse.context (
strorNone) – If provided, will inform the method of the context in which it is being run which may inform special handling cases (e.g. where empty strings may be important / allowable). Defaults toNone.
- Return type:
iterable
- property accessibility: Accessibility | None
Options for configuring accessibility for the chart.
Note
Requires the accessibility module to be loaded in the browser. For a description of the module and information on its features, see Highcharts Accessibility.
- Returns:
The accessibility configuration for the chart or
None- Return type:
Accessibility/None- Raises:
HighchartsError – if setting the value to an incompatible type
- property annotations: List[Annotation] | None
A basic type of an annotation. It allows adding custom labels or shapes. The items can be tied to points, axis coordinates or chart pixel coordinates.
- property boost: Boost | None
Options for the Boost module.
The Boost module allows certain series types to be rendered by WebGL instead of the default SVG. This allows hundreds of thousands of data points to be rendered in milliseconds. In addition to the WebGL rendering it saves time by skipping processing and inspection of the data wherever possible.
Warning
This introduces some limitations to what features are available in boost mode. See the docs for details.
- Returns:
The
Boostobject.- Return type:
Boost
- property caption: Caption | None
The chart’s caption, which will render below the chart and will be part of exported charts.
Note
The caption can be updated after chart initialization through the
Chart.updateorChart.caption.updateJavaScript methods.
- property chart: ChartOptions | None
General options for the chart.
Note
This property is perhaps one of the most important properties you will use when configuring your Highcharts data visualization.
- property color_axis: List[ColorAxis] | None
A color axis for series.
Visually, the color axis will appear as a gradient or as separate items inside the legend, depending on whether the axis is scalar or based on data classes.
A scalar color axis is represented by a gradient. The colors either range between the
minimum_colorand themaximum_color, or for more fine grained control the colors can be defined in stops. Often times, the color axis needs to be adjusted to get the right color spread for the data. In addition to stops, consider using a logarithmic axis type, or setting min and max to avoid the colors being determined by outliers.For supported color formats, please see the documentation article about colors.
When data_classes are used, the ranges are subdivided into separate classes like categories based on their values. This can be used for ranges between two values, but also for a true category. However, when your data is categorized, it may be as convenient to add each category to a separate series.
Warning
Color axis does not work with:
sankey,sunburst,dependencywheel,networkgraph,wordcloud,venn,gaugeandsolidgaugeseries types.See the Axis object for programmatic access to the axis.
- property colors: List[str | Gradient | Pattern] | None
An array containing the default colors for the chart’s series.
When all colors are used, new colors are pulled from the start again.
Default colors can also be set on a series or
series.typebasis, see Column.colors and Pie.colors.Warning
In styled mode, the colors option does not exist.
Instead, colors are defined in CSS and applied either through series or point class names, or through the Chart.color_count option.
Defaults to:
[
    "#7cb5ec",
    "#434348",
    "#90ed7d",
    "#f7a35c",
    "#8085e9",
    "#f15c80",
    "#e4d354",
    "#2b908f",
    "#f45b5b",
    "#91e8e1"
]
- property credits: Credits | None
Highchart by default puts a credits label in the lower right corner of the chart. This can be changed using these options.
- property data: Data | None
The
dataproperty provides a simplified interface for adding data to a chart from sources like CVS, HTML tables, or grid views. See also the tutorial article on the Data module.Warning
It requires the
modules/data.jsfile to be loaded in the browser / client.Warning
Please note that the default way of adding data in Highcharts, without the need of a module, is through the
series.type.dataproperty.
- property defs: MarkerDefinition | None
Options for configuring markers for annotations.
- property drilldown: Drilldown | None
Options to configure drilldown functionality in the chart, which enables users to inspect increasingly high resolution data by clicking on chart items like columns or pie slices.
Note
The drilldown feature requires the
drilldown.jsfile to be loaded in the browser/client. This file is found in the modules directory of the download package, or online at code.highcharts.com/modules/drilldown.js.- Returns:
The options to configure the chart’s drill down functionality.
- Return type:
DrilldownorNone
- property exporting: Exporting | None
Options to configure the export functionality enabled for the chart.
- Returns:
The configuration of the chart’s exporting functionality.
- Return type:
ExportingorNone
- property language: Language | None
Language object which can be used to configure the specific text to use in the chart.
Note
When working in JavaScript, the
langconfiguration is global and it can’t be set on each chart initialization.Instead, use
Highcharts.setOptions()to set it before any chart is initialized.
- property legend: Legend | None
The legend is a box containing a symbol and name for each series item or point item in the chart. Each series (or points in case of pie charts) is represented by a symbol and its name in the legend.
See also
It is possible to override the symbol creator function and create custom legend symbols.
- property loading: Loading | None
The loading options control the appearance of the loading screen that covers the plot area on chart operations.
This screen only appears after an explicit call to
chart.showLoading()in the browser. It is a utility for developers to communicate to the end user that something is going on, for example while retrieving new data via an XHR connection.Hint
The “Loading…” text itself is not part of this configuration object, but is instead part of the
.languageconfiguration.
A collection of options for buttons and menus appearing in the exporting module or in Stock Tools.
- Returns:
The configuration of the navigation buttons.
- Return type:
;class:Navigation or
None
- property no_data: NoData | None
Options for displaying a message like “No data to display”.
Warning
This feature requires the file
no-data-to-display.jsto be loaded in the page.Tip
The actual text to display is set in the
languageoptions.- Returns:
Configuration of how to display a no data message.
- Return type:
NoDataorNone
- property pane: Pane | None
The pane serves as a container for axes and backgrounds for circular gauges and polar charts.
- Returns:
The Pane configuration options.
- Return type:
PaneorNone
- property plot_options: PlotOptions | None
A wrapper object for configurations applied to each series type.
The config objects for each series can also be overridden for each series item as given in the series array.
Configuration options for the series are given in three levels:
Options for all series in a chart are given in the
seriesproperty.Options for all series of a specific type are given in the corresponding property for that type, for example
plot_options.line.Finally, options for one single series are given in the
seriesarray.
- Returns:
Configurations for how series should be plotted / displayed.
- Return type:
PlotOptionsorNone
- property responsive: Responsive | None
Rules to apply for different screen or chart sizes.
Note
Each rule specifies additional chart options.
- Returns:
Rules to apply for different screen or chart sizes.
- Return type:
ResponsiveorNone
- property series: List[GenericTypeOptions] | None
Series options for specific data and the data itself.
- Returns:
The series to display along with configuration and data.
- Return type:
SeriesorNone
- property sonification: SonificationOptions | None
Configuration of global sonification settings for the entire chart.
- Return type:
- property subtitle: Subtitle | None
The chart’s subtitle.
Note
This can be used both to display a subtitle below the main title, and to display random text anywhere in the chart.
Warning
The subtitle can be updated after chart initialization through the
Chart.setTitleJavaScript method.- Returns:
Configuration of the chart’s subtitle.
- Return type:
SubtitleorNone
- property time: Time | None
Time options that can apply globally or to individual charts. These settings affect how datetime axes are laid out, how tooltips are formatted, how series
point_interval_unit <Series.point_interval_unit()works and how the Highcharts Stock range selector handles time.- Returns:
Configuration of applicable Time options.
- Return type:
TimeorNone
- property title: Title | None
Options for configuring the chart’s main title.
- Returns:
Configuration of the chart’s main title.
- Return type:
TitleorNone
- property tooltip: Tooltip | None
Options for the tooltip that appears when the user hovers over a series or point.
- Returns:
Configuration settings for tooltips to display above the chart.
- Return type:
TooltiporNone
- property x_axis: List[XAxis] | None
The X axis or category axis.
Normally this is the horizontal axis, though if the chart is inverted this is the vertical axis.