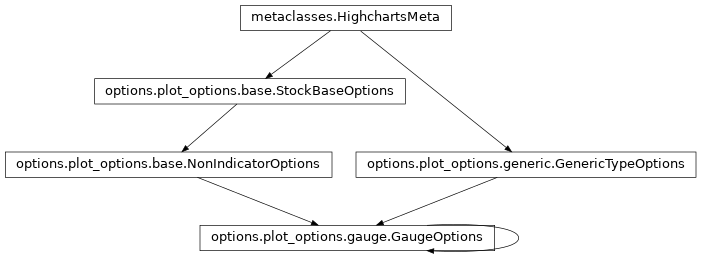
.gauge
class: GaugeOptions
- class GaugeOptions(**kwargs)[source]
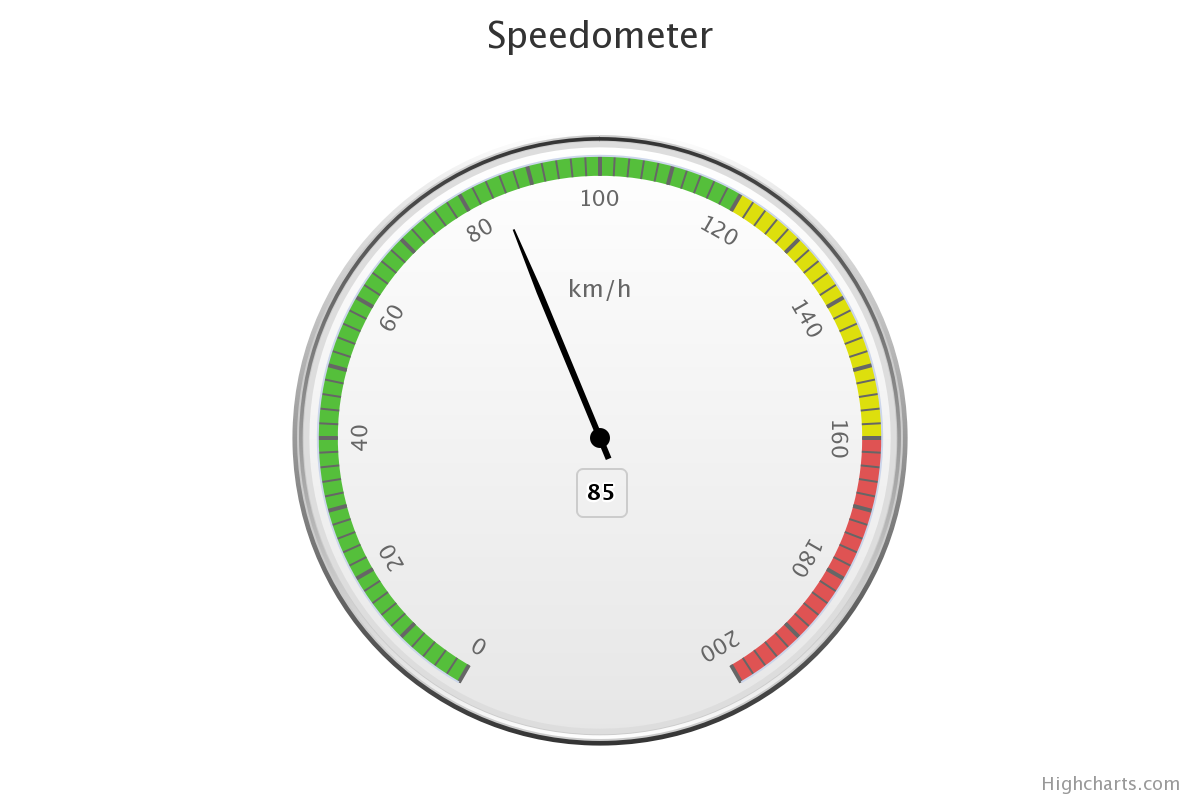
General options to apply to all Gauge series types.
Gauges are circular plots displaying one or more values with a dial pointing to values along the perimeter.
Class Inheritance
- copy(other=None, overwrite=True, **kwargs)
Copy the configuration settings from this instance to the
otherinstance.- Parameters:
other (
HighchartsMeta) – The target instance to which the properties of this instance should be copied. IfNone, will create a new instance and populate it with properties copied fromself. Defaults toNone.overwrite (
bool) – ifTrue, properties inotherthat are already set will be overwritten by their counterparts inself. Defaults toTrue.kwargs – Additional keyword arguments. Some special descendents of
HighchartsMetamay have special implementations of this method which rely on additional keyword arguments.
- Returns:
A mutated version of
otherwith new property values
- classmethod from_dict(as_dict: dict, allow_snake_case: bool = True)
Construct an instance of the class from a
dictobject.
- classmethod from_js_literal(as_str_or_file, allow_snake_case: bool = True, _break_loop_on_failure: bool = False)
Return a Python object representation of a Highcharts JavaScript object literal.
- Parameters:
as_str_or_file (
str) – The JavaScript object literal, represented either as astror as a filename which contains the JS object literal.allow_snake_case (
bool) – IfTrue, interpretssnake_casekeys as equivalent tocamelCasekeys. Defaults toTrue._break_loop_on_failure (
bool) – IfTrue, will break any looping operations in the event of a failure. Otherwise, will attempt to repair the failure. Defaults toFalse.
- Returns:
A Python object representation of the Highcharts JavaScript object literal.
- Return type:
HighchartsMeta
- classmethod from_json(as_json_or_file, allow_snake_case: bool = True)
Construct an instance of the class from a JSON string.
- Parameters:
as_json_or_file – The JSON string for the object or the filename of a file that contains the JSON string.
allow_snake_case (
bool) – IfTrue, interpretssnake_casekeys as equivalent tocamelCasekeys. Defaults toTrue.
- Returns:
A Python objcet representation of
as_json.- Return type:
HighchartsMeta
- get_required_modules(include_extension=False) List[str]
Return the list of URLs from which the Highcharts JavaScript modules needed to render the chart can be retrieved.
- to_dict() dict
Generate a
dictrepresentation of the object compatible with the Highcharts JavaScript library.Note
The
dictrepresentation has a property structure and naming convention that is intentionally consistent with the Highcharts JavaScript library. This is not Pythonic, but it makes managing the interplay between the two languages much, much simpler.
- to_js_literal(filename=None, encoding='utf-8', careful_validation=False) str | None
Return the object represented as a
strcontaining the JavaScript object literal.- Parameters:
along the way using the esprima-python library. Defaults to
False.Warning
Setting this value to
Truewill significantly degrade serialization performance, though it may prove useful for debugging purposes.
- to_json(filename=None, encoding='utf-8')
Generate a JSON string/byte string representation of the object compatible with the Highcharts JavaScript library.
Note
This method will either return a standard
stror abytesobject depending on the JSON serialization library you are using. For example, if your environment has orjson, the result will be abytesrepresentation of the string.- Parameters:
- Returns:
A JSON representation of the object compatible with the Highcharts library.
- Return type:
- static trim_dict(untrimmed: dict, to_json: bool = False, context: str = None) dict
Remove keys from
untrimmedwhose values areNoneand convert values that have.to_dict()methods.- Parameters:
untrimmed (
dict) – Thedictwhose values may still beNoneor Python objects.to_json (
bool) – IfTrue, will remove all keys fromuntrimmedthat are not serializable to JSON. Defaults toFalse.context (
strorNone) – If provided, will inform the method of the context in which it is being run which may inform special handling cases (e.g. where empty strings may be important / allowable). Defaults toNone.
- Returns:
Trimmed
dict- Return type:
- static trim_iterable(untrimmed, to_json=False, context: str = None)
Convert any
EnforcedNullTypevalues inuntrimmedto'null'.- Parameters:
untrimmed (iterable) – The iterable whose members may still be
Noneor Python objects.to_json (
bool) – IfTrue, will remove all members fromuntrimmedthat are not serializable to JSON. Defaults toFalse.context (
strorNone) – If provided, will inform the method of the context in which it is being run which may inform special handling cases (e.g. where empty strings may be important / allowable). Defaults toNone.
- Return type:
iterable
- property accessibility: TypeOptionsAccessibility | None
Accessibility options for a series.
- Return type:
TypeOptionsAccessibilityorNone
- property allow_point_select: bool | None
Allow this series’ points to be selected by clicking on the graphic (columns, point markers, pie slices, map areas etc).
The selected points can be handled in JavaScript by point select and unselect events, or collectively by the (JavaScript)
getSelectedPoints()function.And alternative way of selecting points is through dragging.
Defaults to
False.
- property animation: AnimationOptions | None
Enable or disable the initial animation when a series is displayed.
The animation can also be set as a configuration object. Please note that this option only applies to the initial animation of the series itself. For other animations, see
Chart.animationand theanimationparameter under the (JavaScript) API methods. The following properties are supported:defer: The animation delay time in milliseconds.duration: The duration of the animation in milliseconds.easing: Can be a string reference to an easing function set on the Math object or a function.
Warning
Due to poor performance, animation is disabled in old IE browsers for several chart types.
- Return type:
AnimationOptionsorNone
- property class_name: str | None
The additional CSS class name to apply to the series’ graphical elements.
Note
This option is additive to the default class names - it does not replace them.
- property clip: bool | None
If
False, allows the series to be rendered in the entire plot area. IfTrue, constrains where the series can be rendered within the plot area. Defaults toTrue.
- property color: str | Gradient | Pattern | None
The main color of the series.
In line type series it applies to the line and the point markers unless otherwise specified. In bar type series it applies to the bars unless a color is specified per point. The default value is pulled from the
Options.colors()array.
- property color_index: int | None
When operating in styled mode, a specific color index to use for the series, so that its graphic representations are given the class name
highcharts-color-{n}.Defaults to
None.
- property compare: str | None
Determines whether to display the
'percent'or the'value'of the indicator’s comparison against the main series. Defaults toNone, which does not calculate the comparison.Accepts:
'percent'- returns the percentage calculation for the indicator'value'- returns the axis value calculation for the indicator
- property compare_base: int | None
When
.compareis set to'percent', this option determines whether to use0or100as the basis of comparison. Defaults to0.Accepts:
0100
- property compare_start: bool | None
If
True, the first point in the visible range will be used for the comparative calculation, essentially starting from0. IfFalse, the comparison will be performed based on the data point immediately prior to the visible range. Defaults toFalse.
- property crisp: bool | None
If
True, each point or column edge is rounded to its nearest pixel in order to render sharp on screen. Defaults toTrue.Hint
In some cases, when there are a lot of densely packed columns, this leads to visible difference in column widths or distance between columns. In these cases, setting
crisptoFalsemay look better, even though each column is rendered blurry.
- property cumulative: bool | None
If
True, replaces points’ values with the following (logcical) formula:sum of all previous visible points' values + current point's valueCaution
This calculation is only applied to points in the visible range.
If
False, the point values remain unchanged and are presented as-is. Defaults toFalse.Note
In JavaScript, each point object for the series will now have a new property -
.cumulativeSum- available for use in formatter callback functions or format strings.
- property cursor: str | None
The style of cursor to use when the user’s mouse hovers over the data series.
Acceptable values are:
'alias''all-scroll''auto''cell''col-resize''context-menu''copy''crosshair''default''e-resize''ew-resize''grab''grabbing''help''move''n-resize''ne-resize''nesw-resize''no-drop''none''not-allowed''ns-resize''nw-resize''nwse-resize''pointer''progress''row-resize''s-resize''se-resize''sw-resize''text''vertical-text''w-resize''wait''zoom-in''zoom-out'
- property custom: JavaScriptDict | None
A reserved subspace to store options and values for customized functionality.
Here you can add additional data for your own event callbacks and formatter callbacks.
- property dash_style: str | None
Name of the dash style to use for the graph, or for some series types the outline of each shape.
Accepts one of the following values:
‘Dash’,
‘DashDot’,
‘Dot’,
‘LongDash’,
‘LongDashDot’,
‘LongDashDotDot’,
‘ShortDash’,
‘ShortDashDot’,
‘ShortDashDotDot’,
‘ShortDot’,
‘Solid’
- property data_as_columns: bool | None
If
True, indicates that the data is structured as columns instead of as rows. Defaults toFalse.
- property data_grouping: DataGroupingOptions | None
Data grouping configures sampling the data values into larger blocks in order to ease readability and increase performance of the JavaScript charts.
Highcharts Stock by default applies data grouping when the points become closer than the number of pixels specified by the
.group_pixel_widthsetting.Note
If data grouping is applied, the grouping information of grouped points can be read (in JavaScript) from
Point.dataGroup.Caution
If point options other than the data itself are set, for example
name,color, or custom properties, the grouping logic will not know how to group it. In this case, the options of the first point instance are copied over to the group point. This can be altered through a customapproximationfunction.
- property data_labels: DataLabel | List[DataLabel] | None
Options for the series data labels, appearing next to each data point.
Note
To have multiple data labels per data point, you can also supply a collection of
DataLabelconfiguration settings.
- property description: str | None
A description of the series to add to the screen reader information about the series.
- property dial: DialOptions | None
Options for the dial or arrow pointer of the gauge.
- Return type:
DialOptionsorNone
- property enable_mouse_tracking: bool | None
If
True, enables mouse tracking for the series (used to capture point tooltips, click events on graphs and points, etc.). IfFalse, disables mouse tracking for the series (which can help performance). Defaults toTrue.
- property events: SeriesEvents | None
General event handlers for the series items.
Note
These event hooks can also be attached to the series at run time using the (JavaScript)
Highcharts.addEvent()function.- Return type:
SeriesEventsorNone
- property gap_size: int | float | Decimal | None
In combination with
.gap_unitdefines when to display a gap in the graph. Defaults to0.Note
If
.data_groupingis enabled, points can be grouped into a larger time span. This can make the grouped points have a greater distance than the absolute value of the.gap_sizeproperty, which would result in data disappearing from view completely. To prevent this situation, the mentioned distance between grouped points is applied rather than the explicitly supplied.gap_size.Tip
In practice, this option is most often used to visualize gaps in time series. In a stock chart, intraday data is available for daytime hours, while gaps will appear in nights and weekends.
- Return type:
numeric or
None
- property gap_unit: str | None
In combination with
.gap_sizedefines when to display a gap in the graph. Defaults to'relative'.Accepts two possible values:
'relative'- determines the gap based on a multiple of.gap_size. For example, with a.gap_sizeof5, if the distance between two points is greater than 5x the two closest points, a gap will be rendered.'value'- determines the gap based on the absolute axis values, which on a datetime axis are expressed in milliseconds.
- property include_in_data_export: bool | None
If
False, will prevent the data series from being included in any form of data export. Defaults toTrue.
- property keys: List[str] | None
An array specifying which option maps to which key in the data point array.
This makes it convenient to work with unstructured data arrays from different sources.
- property label: SeriesLabel | None
Series labels are placed as close to the series as possible in a natural way, seeking to avoid other series. The goal of this feature is to make the chart more easily readable, like if a human designer placed the labels in the optimal position.
Note
The series labels currently work with series types having a graph or an area.
- Return type:
SeriesLabelorNone
- property last_price: LastPriceOptions | None
Configuration of a line marking the last price from all data points (whether visible or not). Defaults to
None.See also
- Return type:
- property last_visible_price: LastPriceOptions | None
Configuration of a line marking the last price from all visible data points. Defaults to
None.See also
- Return type:
LastPriceOptionsorNone
- property legend_symbol: str | None
The type of legend symbol to render for the series. Accepts either
'lineMarker'or'rectangle'. Defaults to'rectangle'.- Return type:
- property line_width: int | float | Decimal | None
Pixel width of the graph line. Defaults to
2.- Return type:
numeric or
None
- property linecap: str | None
The SVG value used for the
stroke-linecapandstroke-linejoinof a line graph. Defaults to'round', which means that lines are rounded in the ends and bends.
- property linked_to: str | None
The id of another series to link to.
Hint
The value can be
':previous'to link to the previous series. When two series are linked, only the first one appears in the legend. Toggling the visibility of this also toggles the linked series.Note
If the master series uses data sorting and linked series does not have its own sorting definition, the linked series will be sorted in the same order as the master one.
- property marker: Marker | None
Options for the point markers of line-like series.
Properties like
fill_color,line_colorandline_widthdefine the visual appearance of the markers. Other series types, like column series, don’t have markers, but have visual options on the series level instead.- Return type:
MarkerorNone
Options for the corresponding navigator series if
.show_in_navigatorisTruefor this series. Defaults toNoneNote
These options are merged with options in
navigator.series, and will take precedence if the same option is defined both places.- Return type:
NavigatorOptionsorNone
- property on_point: OnPointOptions | None
Options for the Series on point feature, which is currently only supported by
pieandsunburstchargs.- Return type:
OnPointOptionsorNone
- property opacity: float | None
Opacity of a series parts: line, fill (e.g. area), and labels.
- Return type:
- property overshoot: int | float | Decimal | None
Allow the dial to overshoot the end of the perimeter axis by this many degrees.
For example, if this option is set to
5and the gauge axis goes from0to60, a value of100, or1000, will show5degrees beyond the end of the axis.Defaults to
None.- Return type:
numeric or
None
- property pivot: PivotOptions | None
Options for the pivot or the center point of the gauge.
- Return type:
PivotOptionsorNone
- property point_description_formatter: CallbackFunction | None
Same as for
Accessibility.series.description_formatter(), only for an individual series. Overrides the chart-wide configuration.- Return type:
CallbackFunctionorNone
- property point_interval: int | float | Decimal | None
If no x values are given for the points in a series,
point_intervaldefines the interval of the x values. Defaults to1.For example, if a series contains one value every decade starting from year 0, set
point_intervalto10. In true datetime axes, thepoint_intervalis set in milliseconds.Hint
point_intervalcan be also be combined withpoint_interval_unitto draw irregular time intervals.Note
If combined with
relative_x_value, an x value can be set on each point, and thepoint_intervalis added x times to thepoint_startsetting.Warning
This options applies to the series data, not the interval of the axis ticks, which is independent.
- Return type:
numeric or
None
- property point_interval_unit: str | None
On datetime series, this allows for setting the
point_intervalto irregular time units, day, month, and year.A day is usually the same as 24 hours, but
point_interval_unitalso takes the DST crossover into consideration when dealing with local time.Combine this option with
point_intervalto draw weeks, quarters, 6 month periods, 10 year periods, etc.Warning
This options applies to the series data, not the interval of the axis ticks, which is independent.
- property point_range: EnforcedNullType | int | float | Decimal | None
The X axis range that each point is valid for, which determines the width of the column. Defaults to
EnforcedNull, which computes the range automatically.On a categorized axis, the range will be
1by default (one category unit). On linear and datetime axes, the range will be computed as the distance between the two closest data points.The default
EnforcedNullmeans it is computed automatically, but the setting can be used to override the default value.Note
If
data_sortingis enabled, the default value is implicitly adjusted to1.- Return type:
numeric or
EnforcedNullTypeorNone
- property point_start: int | float | Decimal | None
If no x values are given for the points in a series,
point_startdefines on what value to start. For example, if a series contains one yearly value starting from 1945, setpoint_startto1945. Defaults to0.Note
If combined with
relative_x_value, an x value can be set on each point. The x value from the point options is multiplied bypoint_intervaland added topoint_startto produce a modified x value.- Return type:
numeric or
None
- property relative_x_value: bool | None
When
True, X values in the data set are relative to the currentpoint_start,point_interval, andpoint_interval_unitsettings. This allows compression of the data for datasets with irregular X values. Defaults toFalse.The real X values are computed on the formula
f(x) = ax + b, whereais thepoint_interval(optionally with a time unit given bypoint_interval_unit), andbis thepoint_start.
- property selected: bool | None
If
True, the series is selected initially (by default, without user interaction). Defaults toFalse.Note
If
GenericTypeOptions.show_checkbox()isTrue, then the checkbox will be checked ifselectedisTrue.
- property shadow: bool | ShadowOptions | None
Configuration for the shadow to apply to the tooltip. Defaults to
False.If
False, no shadow is applied.- Returns:
The shadow configuration to apply or a boolean setting which hides the shadow or displays the default shadow.
- Return type:
boolorShadowOptions
- property show_checkbox: bool | None
If
True, a checkbox is displayed next to the legend item to allow selecting the series.Note
The state of the checkbox is controlled by the
GenericTypeOptions.selected()property.
- property show_in_legend: bool | None
Whether to display this particular series or series type in the legend. Standalone series are shown in the legend by default, and linked series are not.
If
True, shows the series in the navigator. Defaults toNone.Note
Takes precedence over
Navigator.base_seriesif provided.
If
True, the accessibility module will skip past this series when executing keyboard navigation.
- property sonification: SeriesSonification | None
Sonification configuration for the series type/series.
- Return type:
- property states: States | None
Configuration for state-specific configuration to apply to the data series.
- Return type:
StatesorNone
- property sticky_tracking: bool | None
Sticky tracking of mouse events.
When
True, the (JavaScript)mouseOutevent on a series is not triggered until the mouse moves over another series, or out of the plot area.When
False, the (JavaScript)mouseOutevent on a series is triggered when the mouse leaves the area around the series’ graph or markers. This also implies the tooltip when not shared.When
FalseandPlotOptions.tooltip.shared()is alsoFalse, the tooltip will be hidden when moving the mouse between series.Defaults to
Truefor line and area type series, but toFalsefor columns, pies, etc.Note
The boost module will force this option because of technical limitations.
- property threshold: int | float | Decimal | EnforcedNullType | None
The Y axis value to serve as the base for the columns, for distinguishing between values above and below a threshold. Defaults to
0.If
EnforcedNullType, the columns extend from the padding Y axis minimum.- Return type:
numeric or
EnforcedNullTypeorNone
- property tooltip: Tooltip | None
A configuration object for the tooltip rendering of each single series. Properties are inherited from tooltip, but only the following properties can be defined on a series level.
- Return type:
TooltiporNone
- property turbo_threshold: int | None
When a series contains a data array longer than this value, only one dimensional arrays of numbers, or two dimensional arrays with x and y values are allowed. Also, only the first point is tested, and the rest are assumed to be the same format. This saves expensive data checking and indexing in long series. Set it to
0orNoneto disable.Defaults to
1000.Note
In boost mode, turbo threshold is forced. Only array of numbers or two dimensional arrays are allowed.
- property type: str
Indicates the type of series that is represented by this instance.
Warning
This proprety is read-only!
- Return type:
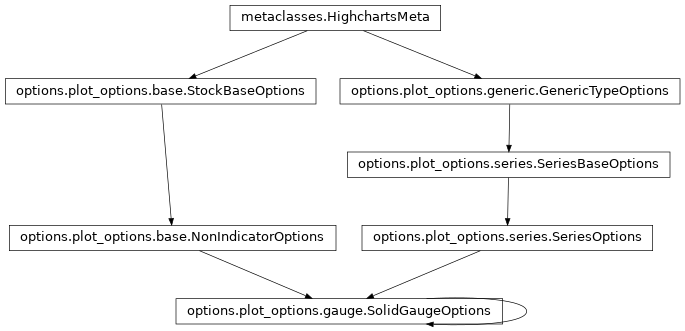
class: SolidGaugeOptions
- class SolidGaugeOptions(**kwargs)[source]
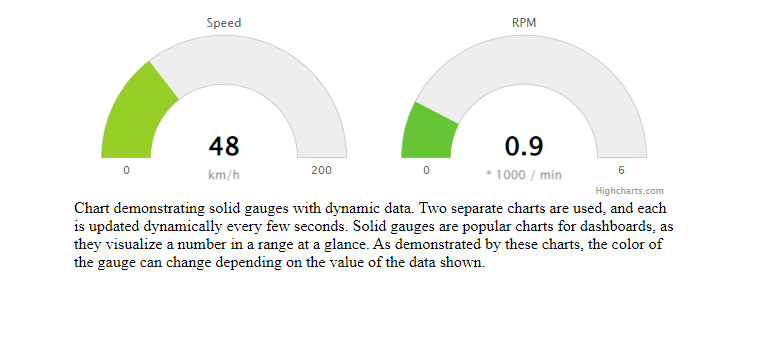
General options to apply to all Solid Gauge series types.
A solid gauge is a circular gauge where the value is indicated by a filled arc, and the color of the arc may variate with the value.
Class Inheritance
- copy(other=None, overwrite=True, **kwargs)
Copy the configuration settings from this instance to the
otherinstance.- Parameters:
other (
HighchartsMeta) – The target instance to which the properties of this instance should be copied. IfNone, will create a new instance and populate it with properties copied fromself. Defaults toNone.overwrite (
bool) – ifTrue, properties inotherthat are already set will be overwritten by their counterparts inself. Defaults toTrue.kwargs – Additional keyword arguments. Some special descendents of
HighchartsMetamay have special implementations of this method which rely on additional keyword arguments.
- Returns:
A mutated version of
otherwith new property values
- classmethod from_dict(as_dict: dict, allow_snake_case: bool = True)
Construct an instance of the class from a
dictobject.
- classmethod from_js_literal(as_str_or_file, allow_snake_case: bool = True, _break_loop_on_failure: bool = False)
Return a Python object representation of a Highcharts JavaScript object literal.
- Parameters:
as_str_or_file (
str) – The JavaScript object literal, represented either as astror as a filename which contains the JS object literal.allow_snake_case (
bool) – IfTrue, interpretssnake_casekeys as equivalent tocamelCasekeys. Defaults toTrue._break_loop_on_failure (
bool) – IfTrue, will break any looping operations in the event of a failure. Otherwise, will attempt to repair the failure. Defaults toFalse.
- Returns:
A Python object representation of the Highcharts JavaScript object literal.
- Return type:
HighchartsMeta
- classmethod from_json(as_json_or_file, allow_snake_case: bool = True)
Construct an instance of the class from a JSON string.
- Parameters:
as_json_or_file – The JSON string for the object or the filename of a file that contains the JSON string.
allow_snake_case (
bool) – IfTrue, interpretssnake_casekeys as equivalent tocamelCasekeys. Defaults toTrue.
- Returns:
A Python objcet representation of
as_json.- Return type:
HighchartsMeta
- get_required_modules(include_extension=False) List[str]
Return the list of URLs from which the Highcharts JavaScript modules needed to render the chart can be retrieved.
- to_dict() dict
Generate a
dictrepresentation of the object compatible with the Highcharts JavaScript library.Note
The
dictrepresentation has a property structure and naming convention that is intentionally consistent with the Highcharts JavaScript library. This is not Pythonic, but it makes managing the interplay between the two languages much, much simpler.
- to_js_literal(filename=None, encoding='utf-8', careful_validation=False) str | None
Return the object represented as a
strcontaining the JavaScript object literal.- Parameters:
along the way using the esprima-python library. Defaults to
False.Warning
Setting this value to
Truewill significantly degrade serialization performance, though it may prove useful for debugging purposes.
- to_json(filename=None, encoding='utf-8')
Generate a JSON string/byte string representation of the object compatible with the Highcharts JavaScript library.
Note
This method will either return a standard
stror abytesobject depending on the JSON serialization library you are using. For example, if your environment has orjson, the result will be abytesrepresentation of the string.- Parameters:
- Returns:
A JSON representation of the object compatible with the Highcharts library.
- Return type:
- static trim_dict(untrimmed: dict, to_json: bool = False, context: str = None) dict
Remove keys from
untrimmedwhose values areNoneand convert values that have.to_dict()methods.- Parameters:
untrimmed (
dict) – Thedictwhose values may still beNoneor Python objects.to_json (
bool) – IfTrue, will remove all keys fromuntrimmedthat are not serializable to JSON. Defaults toFalse.context (
strorNone) – If provided, will inform the method of the context in which it is being run which may inform special handling cases (e.g. where empty strings may be important / allowable). Defaults toNone.
- Returns:
Trimmed
dict- Return type:
- static trim_iterable(untrimmed, to_json=False, context: str = None)
Convert any
EnforcedNullTypevalues inuntrimmedto'null'.- Parameters:
untrimmed (iterable) – The iterable whose members may still be
Noneor Python objects.to_json (
bool) – IfTrue, will remove all members fromuntrimmedthat are not serializable to JSON. Defaults toFalse.context (
strorNone) – If provided, will inform the method of the context in which it is being run which may inform special handling cases (e.g. where empty strings may be important / allowable). Defaults toNone.
- Return type:
iterable
- property accessibility: TypeOptionsAccessibility | None
Accessibility options for a series.
- Return type:
TypeOptionsAccessibilityorNone
- property allow_point_select: bool | None
Allow this series’ points to be selected by clicking on the graphic (columns, point markers, pie slices, map areas etc).
The selected points can be handled in JavaScript by point select and unselect events, or collectively by the (JavaScript)
getSelectedPoints()function.And alternative way of selecting points is through dragging.
Defaults to
False.
- property animation: AnimationOptions | None
Enable or disable the initial animation when a series is displayed.
The animation can also be set as a configuration object. Please note that this option only applies to the initial animation of the series itself. For other animations, see
Chart.animationand theanimationparameter under the (JavaScript) API methods. The following properties are supported:defer: The animation delay time in milliseconds.duration: The duration of the animation in milliseconds.easing: Can be a string reference to an easing function set on the Math object or a function.
Warning
Due to poor performance, animation is disabled in old IE browsers for several chart types.
- Return type:
AnimationOptionsorNone
- property animation_limit: int | float | Decimal | None
For some series, there is a limit that shuts down initial animation by default when the total number of points in the chart is too high. Defaults to
None.For example, for a column chart and its derivatives, animation does not run if there is more than 250 points totally. To disable this cap, set
animation_limittofloat("inf")(which represents infinity).- Return type:
numeric or
None
- property boost_threshold: int | None
Set the point threshold for when a series should enter boost mode. Defaults to
5000.Setting it to e.g. 2000 will cause the series to enter boost mode when there are 2,000 or more points in the series.
To disable boosting on the series, set the
boost_thresholdto0. Setting it to1will force boosting.Note
The
AreaOptions.crop_threshold()also affects this setting.When zooming in on a series that has fewer points than the
crop_threshold, all points are rendered although outside the visible plot area, and theboost_thresholdwon’t take effect.
- property class_name: str | None
The additional CSS class name to apply to the series’ graphical elements.
Note
This option is additive to the default class names - it does not replace them.
- property clip: bool | None
If
False, allows the series to be rendered in the entire plot area. IfTrue, constrains where the series can be rendered within the plot area. Defaults toTrue.
- property color: str | Gradient | Pattern | None
The main color of the series.
In line type series it applies to the line and the point markers unless otherwise specified. In bar type series it applies to the bars unless a color is specified per point. The default value is pulled from the
Options.colors()array.
- property color_axis: str | int | bool | None
When using dual or multiple color axes, this setting defines which color axis the particular series is connected to. It refers to either the
ColorAxis.id()or the index of the axis in theColorAxisarray, with0being the first. Set this option toFalseto prevent a series from connecting to the default color axis.Defaults to
0.
- property color_index: int | None
When operating in styled mode, a specific color index to use for the series, so that its graphic representations are given the class name
highcharts-color-{n}.Tip
New in version Highcharts: (JS) v.11
With Highcharts (JS) v.11, using CSS variables of the form
--highcharts-color-{n}make changing the color scheme very simple.Defaults to
None.
- property color_key: str | None
Determines what data value should be used to calculate point color if
AreaOptions.color_axis()is used.Note
Requires to set
minandmaxif some custom point property is used or if approximation for data grouping is set to'sum'.
- property compare: str | None
Determines whether to display the
'percent'or the'value'of the indicator’s comparison against the main series. Defaults toNone, which does not calculate the comparison.Accepts:
'percent'- returns the percentage calculation for the indicator'value'- returns the axis value calculation for the indicator
- property compare_base: int | None
When
.compareis set to'percent', this option determines whether to use0or100as the basis of comparison. Defaults to0.Accepts:
0100
- property compare_start: bool | None
If
True, the first point in the visible range will be used for the comparative calculation, essentially starting from0. IfFalse, the comparison will be performed based on the data point immediately prior to the visible range. Defaults toFalse.
- property connect_ends: bool | None
If
True, connect the ends of a line series plot across the extremes. Defaults toNone.Warning
Applies to polar charts only.
- property connect_nulls: bool | None
If
True, connect a graph line across null points. IfFalse, renders a gap between the points on either side of the null point. Defaults toFalse.
- property crisp: bool | None
If
True, each point or column edge is rounded to its nearest pixel in order to render sharp on screen. Defaults toTrue.Hint
In some cases, when there are a lot of densely packed columns, this leads to visible difference in column widths or distance between columns. In these cases, setting
crisptoFalsemay look better, even though each column is rendered blurry.
- property crop_threshold: int | None
When the series contains less points than the crop threshold, all points are drawn, even if the points fall outside the visible plot area at the current zoom. Defaults to
300.The advantage of drawing all points (including markers and columns), is that animation is performed on updates. On the other hand, when the series contains more points than the crop threshold, the series data is cropped to only contain points that fall within the plot area. The advantage of cropping away invisible points is to increase performance on large series.
- property cumulative: bool | None
If
True, replaces points’ values with the following (logcical) formula:sum of all previous visible points' values + current point's valueCaution
This calculation is only applied to points in the visible range.
If
False, the point values remain unchanged and are presented as-is. Defaults toFalse.Note
In JavaScript, each point object for the series will now have a new property -
.cumulativeSum- available for use in formatter callback functions or format strings.
- property cursor: str | None
The style of cursor to use when the user’s mouse hovers over the data series.
Acceptable values are:
'alias''all-scroll''auto''cell''col-resize''context-menu''copy''crosshair''default''e-resize''ew-resize''grab''grabbing''help''move''n-resize''ne-resize''nesw-resize''no-drop''none''not-allowed''ns-resize''nw-resize''nwse-resize''pointer''progress''row-resize''s-resize''se-resize''sw-resize''text''vertical-text''w-resize''wait''zoom-in''zoom-out'
- property custom: JavaScriptDict | None
A reserved subspace to store options and values for customized functionality.
Here you can add additional data for your own event callbacks and formatter callbacks.
- property dash_style: str | None
Name of the dash style to use for the graph, or for some series types the outline of each shape.
Accepts one of the following values:
‘Dash’,
‘DashDot’,
‘Dot’,
‘LongDash’,
‘LongDashDot’,
‘LongDashDotDot’,
‘ShortDash’,
‘ShortDashDot’,
‘ShortDashDotDot’,
‘ShortDot’,
‘Solid’
- property data_as_columns: bool | None
If
True, indicates that the data is structured as columns instead of as rows. Defaults toFalse.
- property data_grouping: DataGroupingOptions | None
Data grouping configures sampling the data values into larger blocks in order to ease readability and increase performance of the JavaScript charts.
Highcharts Stock by default applies data grouping when the points become closer than the number of pixels specified by the
.group_pixel_widthsetting.Note
If data grouping is applied, the grouping information of grouped points can be read (in JavaScript) from
Point.dataGroup.Caution
If point options other than the data itself are set, for example
name,color, or custom properties, the grouping logic will not know how to group it. In this case, the options of the first point instance are copied over to the group point. This can be altered through a customapproximationfunction.
- property data_labels: DataLabel | List[DataLabel] | None
Options for the series data labels, appearing next to each data point.
Note
To have multiple data labels per data point, you can also supply a collection of
DataLabelconfiguration settings.
- property data_sorting: DataSorting | None
Options for the series data sorting.
- Return type:
DataSortingorNone
- property description: str | None
A description of the series to add to the screen reader information about the series.
- property drag_drop: DragDropOptions | None
The draggable-points module allows points to be moved around or modified in the chart.
In addition to the options mentioned under the dragDrop API structure, the module fires three (JavaScript) events:
point.dragStartpoint.dragpoint.drop
- Return type:
DragDropOptionsorNone
- property enable_mouse_tracking: bool | None
If
True, enables mouse tracking for the series (used to capture point tooltips, click events on graphs and points, etc.). IfFalse, disables mouse tracking for the series (which can help performance). Defaults toTrue.
- property events: SeriesEvents | None
General event handlers for the series items.
Note
These event hooks can also be attached to the series at run time using the (JavaScript)
Highcharts.addEvent()function.- Return type:
SeriesEventsorNone
- property find_nearest_point_by: str | None
Determines whether the series should look for the nearest point in both dimensions or just the x-dimension when hovering the series.
If
None, defaults to'xy'for scatter series and'x'for most other series. If the data has duplicate x-values, it is recommended to set this to'xy'to allow hovering over all points.Applies only to series types using nearest neighbor search (not direct hover) for tooltip.
- property gap_size: int | float | Decimal | None
In combination with
.gap_unitdefines when to display a gap in the graph. Defaults to0.Note
If
.data_groupingis enabled, points can be grouped into a larger time span. This can make the grouped points have a greater distance than the absolute value of the.gap_sizeproperty, which would result in data disappearing from view completely. To prevent this situation, the mentioned distance between grouped points is applied rather than the explicitly supplied.gap_size.Tip
In practice, this option is most often used to visualize gaps in time series. In a stock chart, intraday data is available for daytime hours, while gaps will appear in nights and weekends.
- Return type:
numeric or
None
- property gap_unit: str | None
In combination with
.gap_sizedefines when to display a gap in the graph. Defaults to'relative'.Accepts two possible values:
'relative'- determines the gap based on a multiple of.gap_size. For example, with a.gap_sizeof5, if the distance between two points is greater than 5x the two closest points, a gap will be rendered.'value'- determines the gap based on the absolute axis values, which on a datetime axis are expressed in milliseconds.
- property get_extremes_from_all: bool | None
If
True, uses the Y extremes of the total chart width or only the zoomed area when zooming in on parts of the X axis. By default, the Y axis adjusts to the min and max of the visible data.Warning
Applies to Cartesian series only.
- property inactive_other_points: bool | None
- If
True, highlights only the hovered point and fades the other points. Defaults to
False.Warning
Scatter-type series require enabling the ‘inactive’ marker state and adjusting opacity. This approach could affect performance
with large datasets.
- If
- property include_in_data_export: bool | None
If
False, will prevent the data series from being included in any form of data export. Defaults toTrue.
- property inner_radius: str | int | float | Decimal | None
The inner radius for points in a solid gauge. Can be given as a number (pixels) or percentage string. Defaults to
60.
- property keys: List[str] | None
An array specifying which option maps to which key in the data point array.
This makes it convenient to work with unstructured data arrays from different sources.
- property label: SeriesLabel | None
Series labels are placed as close to the series as possible in a natural way, seeking to avoid other series. The goal of this feature is to make the chart more easily readable, like if a human designer placed the labels in the optimal position.
Note
The series labels currently work with series types having a graph or an area.
- Return type:
SeriesLabelorNone
- property last_price: LastPriceOptions | None
Configuration of a line marking the last price from all data points (whether visible or not). Defaults to
None.See also
- Return type:
- property last_visible_price: LastPriceOptions | None
Configuration of a line marking the last price from all visible data points. Defaults to
None.See also
- Return type:
LastPriceOptionsorNone
- property legend_symbol: str | None
The type of legend symbol to render for the series. Accepts either
'lineMarker'or'rectangle'. Defaults to'rectangle'.- Return type:
- property line_width: int | float | Decimal | None
Pixel width of the graph line. Defaults to
2.- Return type:
numeric or
None
- property linecap: str | None
The SVG value used for the
stroke-linecapandstroke-linejoinof a line graph. Defaults to'round', which means that lines are rounded in the ends and bends.
- property linked_to: str | None
The id of another series to link to.
Hint
The value can be
':previous'to link to the previous series. When two series are linked, only the first one appears in the legend. Toggling the visibility of this also toggles the linked series.Note
If the master series uses data sorting and linked series does not have its own sorting definition, the linked series will be sorted in the same order as the master one.
- property marker: Marker | None
Options for the point markers of line-like series.
Properties like
fill_color,line_colorandline_widthdefine the visual appearance of the markers. Other series types, like column series, don’t have markers, but have visual options on the series level instead.- Return type:
MarkerorNone
Options for the corresponding navigator series if
.show_in_navigatorisTruefor this series. Defaults toNoneNote
These options are merged with options in
navigator.series, and will take precedence if the same option is defined both places.- Return type:
NavigatorOptionsorNone
- property negative_color: str | Gradient | Pattern | None
The color for the parts of the graph or points that are below the
AreaOptions.threshold().Note
Zonestake precedence over the negative color. Usingnegative_coloris equivalent to applying a zone with value of 0.
- property on_point: OnPointOptions | None
Options for the Series on point feature, which is currently only supported by
pieandsunburstchargs.- Return type:
OnPointOptionsorNone
- property opacity: float | None
Opacity of a series parts: line, fill (e.g. area), and labels.
- Return type:
- property overshoot: int | float | Decimal | None
Allow the dial to overshoot the end of the perimeter axis by this many degrees.
For example, if this option is set to
5and the gauge axis goes from0to60, a value of100, or1000, will show5degrees beyond the end of the axis.Defaults to
0.- Return type:
numeric or
None
- property point_description_format: str | None
A format string to use instead of the default for point descriptions on the series. Defaults to
None.Note
Overrides the chart-wide configuration, as applicable.
- property point_description_formatter: CallbackFunction | None
Same as for
Accessibility.series.description_formatter(), only for an individual series. Overrides the chart-wide configuration.- Return type:
CallbackFunctionorNone
- property point_interval: int | float | Decimal | None
If no x values are given for the points in a series,
point_intervaldefines the interval of the x values. Defaults to1.For example, if a series contains one value every decade starting from year 0, set
point_intervalto10. In true datetime axes, thepoint_intervalis set in milliseconds.Hint
point_intervalcan be also be combined withpoint_interval_unitto draw irregular time intervals.Note
If combined with
relative_x_value, an x value can be set on each point, and thepoint_intervalis added x times to thepoint_startsetting.Warning
This options applies to the series data, not the interval of the axis ticks, which is independent.
- Return type:
numeric or
None
- property point_interval_unit: str | None
On datetime series, this allows for setting the
point_intervalto irregular time units, day, month, and year.A day is usually the same as 24 hours, but
point_interval_unitalso takes the DST crossover into consideration when dealing with local time.Combine this option with
point_intervalto draw weeks, quarters, 6 month periods, 10 year periods, etc.Warning
This options applies to the series data, not the interval of the axis ticks, which is independent.
- property point_placement: str | int | float | Decimal | None
Used to determine the placement of the point in relation to tick marks on the X axis. Defaults to
None, which behaves as undefined in cartesian charts, and"between"in polar charts.Accepts possible values:
'on'- where the point will not create any padding of the X axis. In a polar column chart this means that the first column points directly north."between"- where the columns will be laid out between ticks. This is useful for example for visualising an amount between two points in time or in a certain sector of a polar chart.a numeric value - where
0is on the axis value,-0.5is between this value and the previous, and0.5is between this value and the next. Unlike the textual options, numeric point placement options won’t affect axis padding.
Warning
Requires
point_rangeto work. For column series this is computed, but for line-type series it needs to be set.Note
For the xrange series type and gantt charts, if the Y axis is a category axis, the
point_placementapplies to the Y axis rather than the (typically datetime) X axis.
- property point_range: EnforcedNullType | int | float | Decimal | None
The X axis range that each point is valid for, which determines the width of the column. Defaults to
EnforcedNull, which computes the range automatically.On a categorized axis, the range will be
1by default (one category unit). On linear and datetime axes, the range will be computed as the distance between the two closest data points.The default
EnforcedNullmeans it is computed automatically, but the setting can be used to override the default value.Note
If
data_sortingis enabled, the default value is implicitly adjusted to1.- Return type:
numeric or
EnforcedNullTypeorNone
- property point_start: int | float | Decimal | None
If no x values are given for the points in a series,
point_startdefines on what value to start. For example, if a series contains one yearly value starting from 1945, setpoint_startto1945. Defaults to0.Note
If combined with
relative_x_value, an x value can be set on each point. The x value from the point options is multiplied bypoint_intervaland added topoint_startto produce a modified x value.- Return type:
numeric or
None
- property radius: str | int | float | Decimal | None
The outer radius for points in a solid gauge. Can be given as a number (pixels) or percentage string. Defaults to
100.
- property relative_x_value: bool | None
When
True, X values in the data set are relative to the currentpoint_start,point_interval, andpoint_interval_unitsettings. This allows compression of the data for datasets with irregular X values. Defaults toFalse.The real X values are computed on the formula
f(x) = ax + b, whereais thepoint_interval(optionally with a time unit given bypoint_interval_unit), andbis thepoint_start.
- property selected: bool | None
If
True, the series is selected initially (by default, without user interaction). Defaults toFalse.Note
If
GenericTypeOptions.show_checkbox()isTrue, then the checkbox will be checked ifselectedisTrue.
- property shadow: bool | ShadowOptions | None
Configuration for the shadow to apply to the tooltip. Defaults to
False.If
False, no shadow is applied.- Returns:
The shadow configuration to apply or a boolean setting which hides the shadow or displays the default shadow.
- Return type:
boolorShadowOptions
- property show_checkbox: bool | None
If
True, a checkbox is displayed next to the legend item to allow selecting the series.Note
The state of the checkbox is controlled by the
GenericTypeOptions.selected()property.
- property show_in_legend: bool | None
Whether to display this particular series or series type in the legend. Standalone series are shown in the legend by default, and linked series are not.
If
True, shows the series in the navigator. Defaults toNone.Note
Takes precedence over
Navigator.base_seriesif provided.
If
True, the accessibility module will skip past this series when executing keyboard navigation.
- property soft_threshold: bool | None
When
True, the series will not cause the Y axis to cross the zero plane (or threshold option) unless the data actually crosses the plane. Defaults toTrue.For example, if
False, a series of0, 1, 2, 3will make the Y axis show negative values according to themin_padidngoption. IfTrue, the Y axis starts at 0.- Return type:
- property sonification: SeriesSonification | None
Sonification configuration for the series type/series.
- Return type:
- property stacking: str | None
Whether to stack the values of each series on top of each other. Defaults to
None.Acceptable values are:
Noneto disable stacking,"normal"to stack by value or"percent"'stream'(for streamgraph series type only)'overlap'(for waterfall series type only)
Note
When stacking is enabled, data must be sorted in ascending X order.
- property states: States | None
Configuration for state-specific configuration to apply to the data series.
- Return type:
StatesorNone
- property step: str | None
Whether to apply steps to the line. Defaults to
None.Possible values are:
'left''center''right'
- property sticky_tracking: bool | None
Sticky tracking of mouse events.
When
True, the (JavaScript)mouseOutevent on a series is not triggered until the mouse moves over another series, or out of the plot area.When
False, the (JavaScript)mouseOutevent on a series is triggered when the mouse leaves the area around the series’ graph or markers. This also implies the tooltip when not shared.When
FalseandPlotOptions.tooltip.shared()is alsoFalse, the tooltip will be hidden when moving the mouse between series.Defaults to
Truefor line and area type series, but toFalsefor columns, pies, etc.Note
The boost module will force this option because of technical limitations.
- property threshold: int | float | Decimal | EnforcedNullType | None
The Y axis value to serve as the base for the columns, for distinguishing between values above and below a threshold. Defaults to
0.If
EnforcedNullType, the columns extend from the padding Y axis minimum.- Return type:
numeric or
EnforcedNullTypeorNone
- property tooltip: Tooltip | None
A configuration object for the tooltip rendering of each single series. Properties are inherited from tooltip, but only the following properties can be defined on a series level.
- Return type:
TooltiporNone
- property turbo_threshold: int | None
When a series contains a data array longer than this value, only one dimensional arrays of numbers, or two dimensional arrays with x and y values are allowed. Also, only the first point is tested, and the rest are assumed to be the same format. This saves expensive data checking and indexing in long series. Set it to
0orNoneto disable.Defaults to
1000.Note
In boost mode, turbo threshold is forced. Only array of numbers or two dimensional arrays are allowed.
- property type: str
Indicates the type of series that is represented by this instance.
Warning
This proprety is read-only!
- Return type:
- property visible: bool | None
If
True, the series is initially visible. IfFalse, the series is hidden by default. Defaults toTrue.
class: PivotOptions
- class PivotOptions(**kwargs)[source]
Options for the pivot or the center point of the gauge.
Class Inheritance
- copy(other=None, overwrite=True, **kwargs)
Copy the configuration settings from this instance to the
otherinstance.- Parameters:
other (
HighchartsMeta) – The target instance to which the properties of this instance should be copied. IfNone, will create a new instance and populate it with properties copied fromself. Defaults toNone.overwrite (
bool) – ifTrue, properties inotherthat are already set will be overwritten by their counterparts inself. Defaults toTrue.kwargs – Additional keyword arguments. Some special descendents of
HighchartsMetamay have special implementations of this method which rely on additional keyword arguments.
- Returns:
A mutated version of
otherwith new property values
- classmethod from_dict(as_dict: dict, allow_snake_case: bool = True)
Construct an instance of the class from a
dictobject.
- classmethod from_js_literal(as_str_or_file, allow_snake_case: bool = True, _break_loop_on_failure: bool = False)
Return a Python object representation of a Highcharts JavaScript object literal.
- Parameters:
as_str_or_file (
str) – The JavaScript object literal, represented either as astror as a filename which contains the JS object literal.allow_snake_case (
bool) – IfTrue, interpretssnake_casekeys as equivalent tocamelCasekeys. Defaults toTrue._break_loop_on_failure (
bool) – IfTrue, will break any looping operations in the event of a failure. Otherwise, will attempt to repair the failure. Defaults toFalse.
- Returns:
A Python object representation of the Highcharts JavaScript object literal.
- Return type:
HighchartsMeta
- classmethod from_json(as_json_or_file, allow_snake_case: bool = True)
Construct an instance of the class from a JSON string.
- Parameters:
as_json_or_file – The JSON string for the object or the filename of a file that contains the JSON string.
allow_snake_case (
bool) – IfTrue, interpretssnake_casekeys as equivalent tocamelCasekeys. Defaults toTrue.
- Returns:
A Python objcet representation of
as_json.- Return type:
HighchartsMeta
- get_required_modules(include_extension=False) List[str]
Return the list of URLs from which the Highcharts JavaScript modules needed to render the chart can be retrieved.
- to_dict() dict
Generate a
dictrepresentation of the object compatible with the Highcharts JavaScript library.Note
The
dictrepresentation has a property structure and naming convention that is intentionally consistent with the Highcharts JavaScript library. This is not Pythonic, but it makes managing the interplay between the two languages much, much simpler.
- to_js_literal(filename=None, encoding='utf-8', careful_validation=False) str | None
Return the object represented as a
strcontaining the JavaScript object literal.- Parameters:
along the way using the esprima-python library. Defaults to
False.Warning
Setting this value to
Truewill significantly degrade serialization performance, though it may prove useful for debugging purposes.
- to_json(filename=None, encoding='utf-8')
Generate a JSON string/byte string representation of the object compatible with the Highcharts JavaScript library.
Note
This method will either return a standard
stror abytesobject depending on the JSON serialization library you are using. For example, if your environment has orjson, the result will be abytesrepresentation of the string.- Parameters:
- Returns:
A JSON representation of the object compatible with the Highcharts library.
- Return type:
- static trim_dict(untrimmed: dict, to_json: bool = False, context: str = None) dict
Remove keys from
untrimmedwhose values areNoneand convert values that have.to_dict()methods.- Parameters:
untrimmed (
dict) – Thedictwhose values may still beNoneor Python objects.to_json (
bool) – IfTrue, will remove all keys fromuntrimmedthat are not serializable to JSON. Defaults toFalse.context (
strorNone) – If provided, will inform the method of the context in which it is being run which may inform special handling cases (e.g. where empty strings may be important / allowable). Defaults toNone.
- Returns:
Trimmed
dict- Return type:
- static trim_iterable(untrimmed, to_json=False, context: str = None)
Convert any
EnforcedNullTypevalues inuntrimmedto'null'.- Parameters:
untrimmed (iterable) – The iterable whose members may still be
Noneor Python objects.to_json (
bool) – IfTrue, will remove all members fromuntrimmedthat are not serializable to JSON. Defaults toFalse.context (
strorNone) – If provided, will inform the method of the context in which it is being run which may inform special handling cases (e.g. where empty strings may be important / allowable). Defaults toNone.
- Return type:
iterable
- property background_color: str | Gradient | Pattern | None
The background color or fill of the pivot. Defaults to ‘#000000’.
- property border_color: str | Gradient | Pattern | None
The border or stroke color of the pivot. Defaults to
'#cccccc'.Warning
By default, the
PivotOptions.border_width()is0, so be sure to set that property to a non-default value if you wish to apply a border color.
class: DialOptions
- class DialOptions(**kwargs)[source]
Options for the dial or arrow pointer of the gauge.
Class Inheritance
- copy(other=None, overwrite=True, **kwargs)
Copy the configuration settings from this instance to the
otherinstance.- Parameters:
other (
HighchartsMeta) – The target instance to which the properties of this instance should be copied. IfNone, will create a new instance and populate it with properties copied fromself. Defaults toNone.overwrite (
bool) – ifTrue, properties inotherthat are already set will be overwritten by their counterparts inself. Defaults toTrue.kwargs – Additional keyword arguments. Some special descendents of
HighchartsMetamay have special implementations of this method which rely on additional keyword arguments.
- Returns:
A mutated version of
otherwith new property values
- classmethod from_dict(as_dict: dict, allow_snake_case: bool = True)
Construct an instance of the class from a
dictobject.
- classmethod from_js_literal(as_str_or_file, allow_snake_case: bool = True, _break_loop_on_failure: bool = False)
Return a Python object representation of a Highcharts JavaScript object literal.
- Parameters:
as_str_or_file (
str) – The JavaScript object literal, represented either as astror as a filename which contains the JS object literal.allow_snake_case (
bool) – IfTrue, interpretssnake_casekeys as equivalent tocamelCasekeys. Defaults toTrue._break_loop_on_failure (
bool) – IfTrue, will break any looping operations in the event of a failure. Otherwise, will attempt to repair the failure. Defaults toFalse.
- Returns:
A Python object representation of the Highcharts JavaScript object literal.
- Return type:
HighchartsMeta
- classmethod from_json(as_json_or_file, allow_snake_case: bool = True)
Construct an instance of the class from a JSON string.
- Parameters:
as_json_or_file – The JSON string for the object or the filename of a file that contains the JSON string.
allow_snake_case (
bool) – IfTrue, interpretssnake_casekeys as equivalent tocamelCasekeys. Defaults toTrue.
- Returns:
A Python objcet representation of
as_json.- Return type:
HighchartsMeta
- get_required_modules(include_extension=False) List[str]
Return the list of URLs from which the Highcharts JavaScript modules needed to render the chart can be retrieved.
- to_dict() dict
Generate a
dictrepresentation of the object compatible with the Highcharts JavaScript library.Note
The
dictrepresentation has a property structure and naming convention that is intentionally consistent with the Highcharts JavaScript library. This is not Pythonic, but it makes managing the interplay between the two languages much, much simpler.
- to_js_literal(filename=None, encoding='utf-8', careful_validation=False) str | None
Return the object represented as a
strcontaining the JavaScript object literal.- Parameters:
along the way using the esprima-python library. Defaults to
False.Warning
Setting this value to
Truewill significantly degrade serialization performance, though it may prove useful for debugging purposes.
- to_json(filename=None, encoding='utf-8')
Generate a JSON string/byte string representation of the object compatible with the Highcharts JavaScript library.
Note
This method will either return a standard
stror abytesobject depending on the JSON serialization library you are using. For example, if your environment has orjson, the result will be abytesrepresentation of the string.- Parameters:
- Returns:
A JSON representation of the object compatible with the Highcharts library.
- Return type:
- static trim_dict(untrimmed: dict, to_json: bool = False, context: str = None) dict
Remove keys from
untrimmedwhose values areNoneand convert values that have.to_dict()methods.- Parameters:
untrimmed (
dict) – Thedictwhose values may still beNoneor Python objects.to_json (
bool) – IfTrue, will remove all keys fromuntrimmedthat are not serializable to JSON. Defaults toFalse.context (
strorNone) – If provided, will inform the method of the context in which it is being run which may inform special handling cases (e.g. where empty strings may be important / allowable). Defaults toNone.
- Returns:
Trimmed
dict- Return type:
- static trim_iterable(untrimmed, to_json=False, context: str = None)
Convert any
EnforcedNullTypevalues inuntrimmedto'null'.- Parameters:
untrimmed (iterable) – The iterable whose members may still be
Noneor Python objects.to_json (
bool) – IfTrue, will remove all members fromuntrimmedthat are not serializable to JSON. Defaults toFalse.context (
strorNone) – If provided, will inform the method of the context in which it is being run which may inform special handling cases (e.g. where empty strings may be important / allowable). Defaults toNone.
- Return type:
iterable
- property background_color: str | Gradient | Pattern | None
The background or fill color of the gauge’s dial. Defaults to ‘#000000’.
- property base_length: str | None
The length of the dial’s base part, expressed as a percentage of the total radius or length of the dial. Defaults to
70%.
- property base_width: int | float | Decimal | None
The pixel width of the base of the gauge dial. Defaults to
3.Note
The base is the part closest to the pivot, defined by
DialOptions.base_length().- Return type:
numeric or
None
- property border_color: str | Gradient | Pattern | None
The border color or stroke of the gauge’s dial. Defaults to
'#cccccc'.Warning
By default, the
DialOptions.border_width()is0, so be sure to set that property to a non-default value if you wish to apply a border color.
- property border_width: int | float | Decimal | None
The width of the gauge dial border in pixels. Defaults to
0.- Return type:
numeric or
None
- property radius: str | None
The radius or length of the dial, in percentages relative to the radius of the gauge itself. Defaults to
'80%'.